
IntroToCryptos.ca
Bitcoin Dominance Explained: Why One Number Hides Which Altcoins Are Moving

Have you ever watched Bitcoin dominance drop, bought a handful of alts, and still watched them bleed against BTC?
You did what the chart said, and your coins still didn’t move.
I’ve been there. More than once.
Here’s what most trading guides don’t tell you. Bitcoin dominance is one number, and one number can’t tell you which coins are actually moving.
So what would change if you could see inside that number? What if you could split it apart, the way a prism splits white light into a full rainbow?
That’s what this guide is about. Bookmark it, because every other dominance post on this site comes back here.
In this guide:
- What Bitcoin dominance measures
- Why dominance is “white light”
- The prism: how the AltSeason CoPilot sees inside dominance
- The Three Portfolio States
- What the spectrum shows: the long tail, breadth and the leaders
- From colors to trades: the five stages
- My $500,000 lesson
- Bitcoin dominance FAQ
Bitcoin dominance explained: what it measures
Bitcoin dominance is Bitcoin’s share of the whole crypto market. If the total market were worth $100 and Bitcoin made up $55 of it, dominance would be 55%.
That’s it. It’s a market-share number.
When dominance rises, Bitcoin is taking a bigger slice of the pie. The alts, as a group, are losing ground against BTC.
When dominance falls, the alts as a group are gaining on Bitcoin. Money is rotating out of BTC and into everything else.
Now here’s the part that trips people up. Dominance can rise while Bitcoin’s price falls.
If BTC drops and its share still grows, the alts are falling even faster. That’s the worst place to be holding altcoins.
So dominance always gets read two ways at once. Which way is dominance going? And which way is Bitcoin going?
Dominance is white light
Think about white light. It looks like one color, but it’s every color mixed together.
Bitcoin dominance works the same way. It blends every coin on the market into one line.
And averages hide things. A drop of a few points in dominance can come from a handful of coins running hard while most of the market sits still.
I saw this in my own data back in 2020. Out of about 160 coins on the exchange I was tracking, only around 40 had done anything in two small rallies.
The rest went nowhere. They were just along for the ride in the average.
That’s the trap with trading the average. Buy “the alts” because dominance is falling, and most of what you own may be coins that never move.
So the real question isn’t “Is it alt season?” It’s “Which alts are in it?”
The prism: how the system sees inside dominance
A prism takes one beam of white light and bends each color a different amount. What comes out the other side is the full spectrum.
The AltSeason CoPilot does the same thing to Bitcoin dominance. Instead of one blended line, it grades every coin’s own ALT/BTC daily chart.
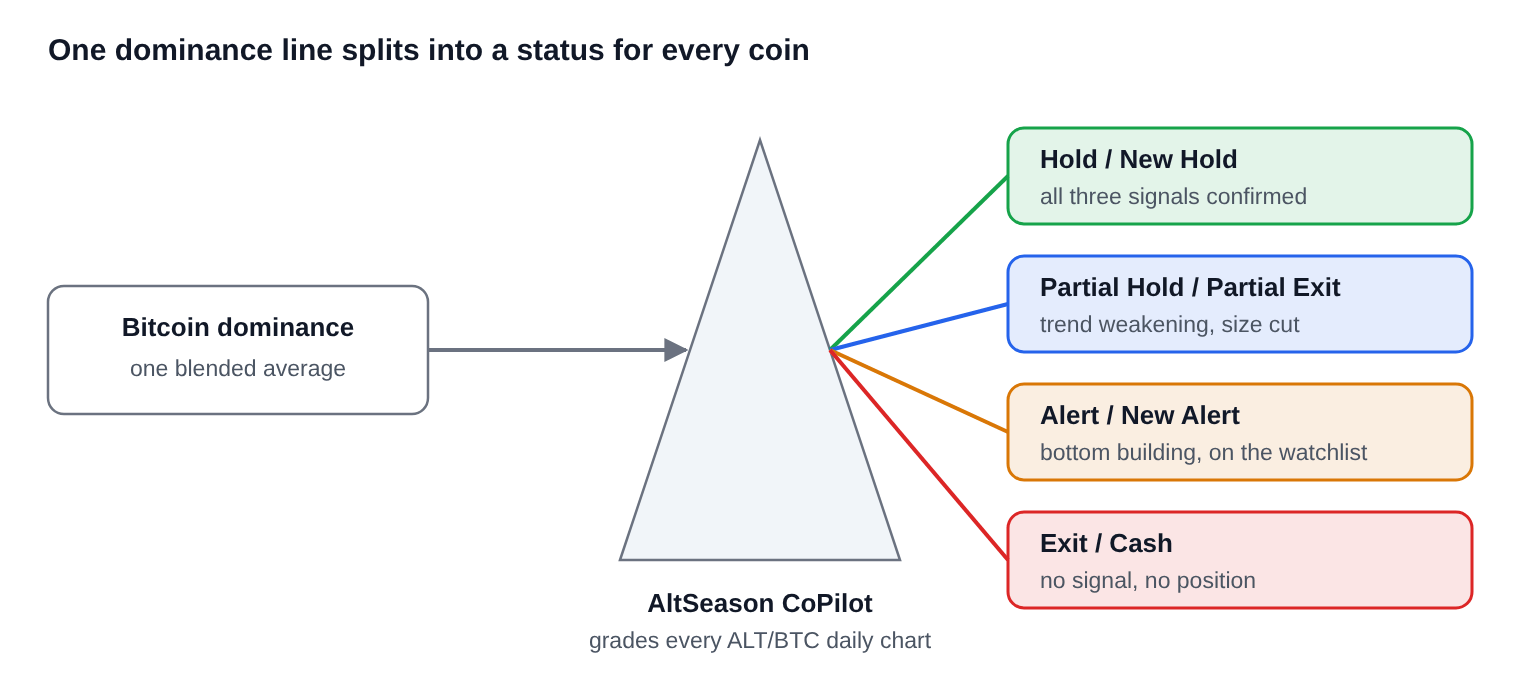
Each coin lands in a status on the Daily Action Matrix. If you want to see the matrix itself, I walk through it in the Daily Action Matrix reveal.
Read top to bottom, those statuses are the spectrum hiding inside the dominance line.
The dominance chart tells you the weather. The spectrum tells you which coins are actually out in the sun.
The Three Portfolio States
The whole portfolio lives in one of three states: USDT, BTC, or Diversified Alts. Dominance and Bitcoin’s direction, read together, show which one fits the market.
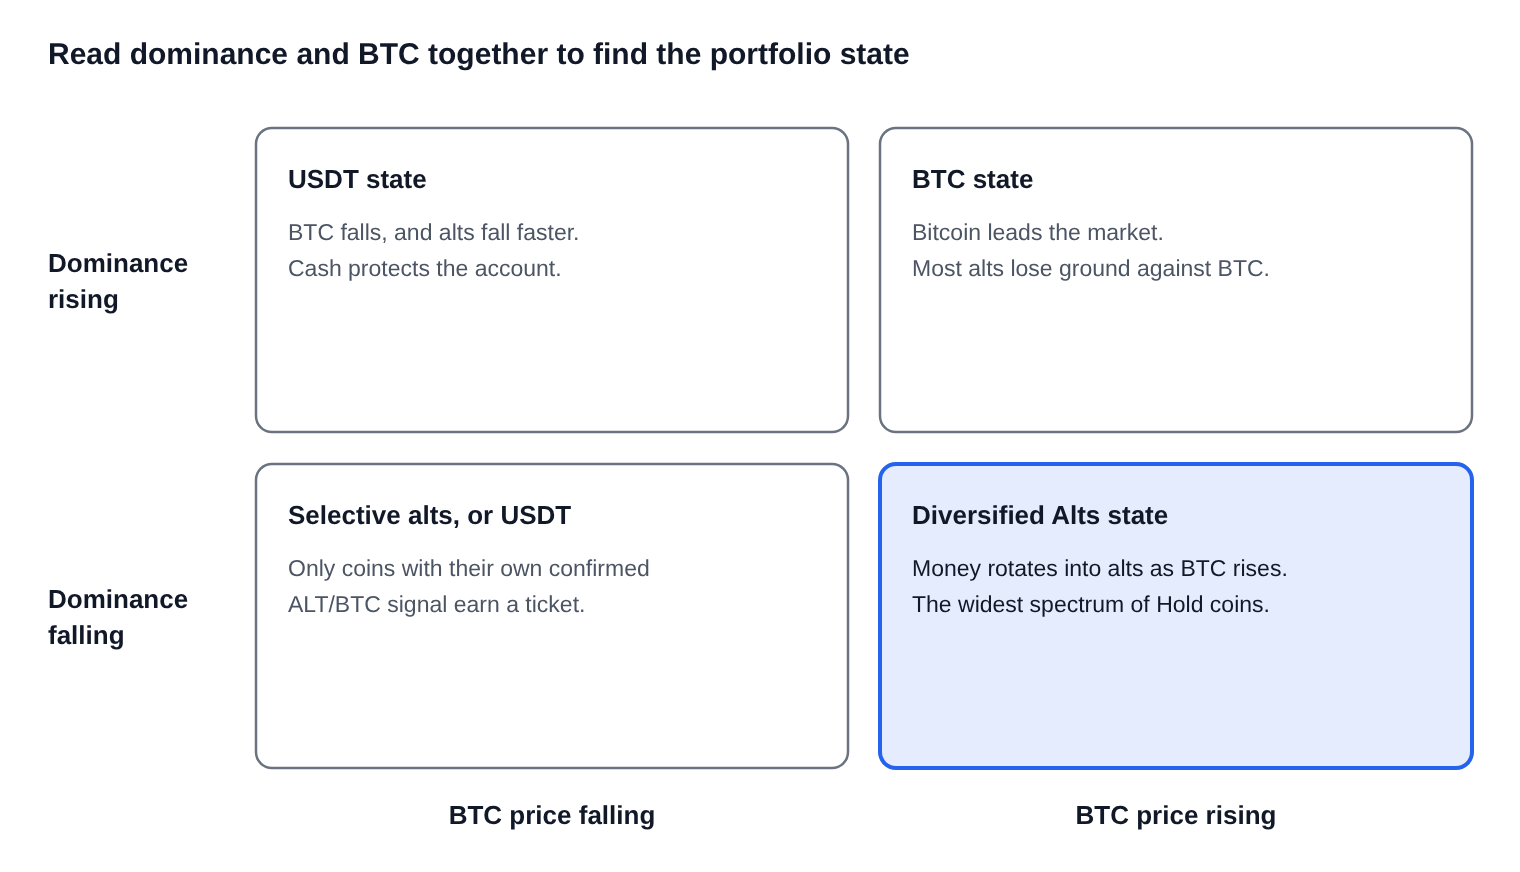
One thing to be clear on. The system doesn’t trade the dominance chart itself.
The portfolio state comes from the 10/40 EMA on the BTC/USD daily chart. You can see how that reads right now in where Bitcoin is in the cycle.
Each alt earns its place from its own ALT/BTC daily chart. The grid is how those signals tend to line up with dominance.
It’s a map for understanding, not a trigger to act on.
What you see on the other side of the prism
Once dominance is split apart, three things jump out. Each one is something the average hides.
1. The long tail of altcoin returns
Most coins in any rally do very little. A few do far more than anyone expects.
That shape has a name: the long-tail distribution of returns. A rough rule of thumb is 80/20, where most positions make little and a small group carries the results.
Think about a home run in baseball. It’s the best hit in the game, and it still only scores four runs.
A crypto winner isn’t capped like that. One strong winner can pay for a whole row of small tries that didn’t work.
Venture capital runs on the same idea. Most bets fizzle, and a few carry the whole fund.
The catch? You can’t know ahead of time which coins will be the winners.
I’ve never been able to. I’ve stopped pretending I can.
Even the 1-2-3 trend change formation we trade fails about 8 times out of 10. That’s exactly why the system spreads small tickets across many coins instead of betting big on a favorite.
2. Breadth: how many coins are lighting up
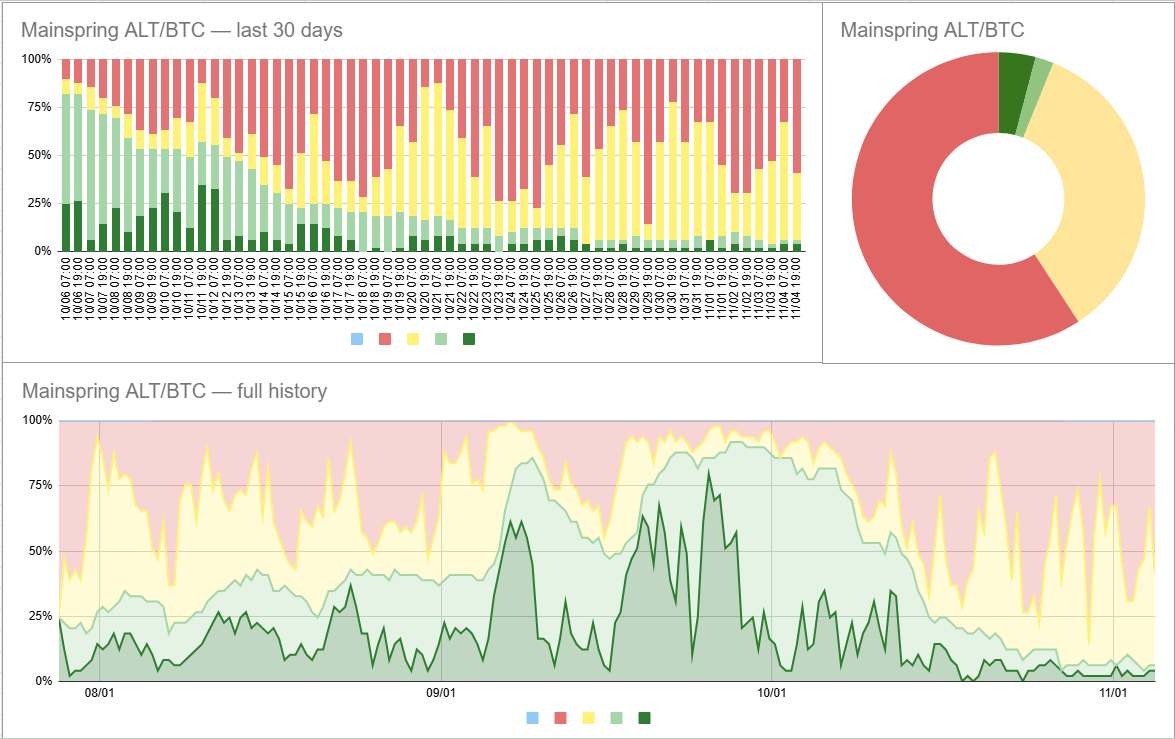
The Daily Action Matrix tracks how many coins sit in Alert and Hold each day. That count shows the shape of the spectrum, not just its average.
When the Alert count climbs, money is starting to find its way into alts. It often shows up in the coin count before the dominance line confirms anything.
When the count drains down to almost nothing, the spectrum has gone dark. That’s information too.
3. The leaders
Some coins give notice early. They moved in the last small rally, or they held above old support while everything else sank.
Those leaders tend to be the first to light up again. So they go to the top of the watchlist.
Not always. Nothing’s always. But it’s where I look first.
From colors to trades: the five stages
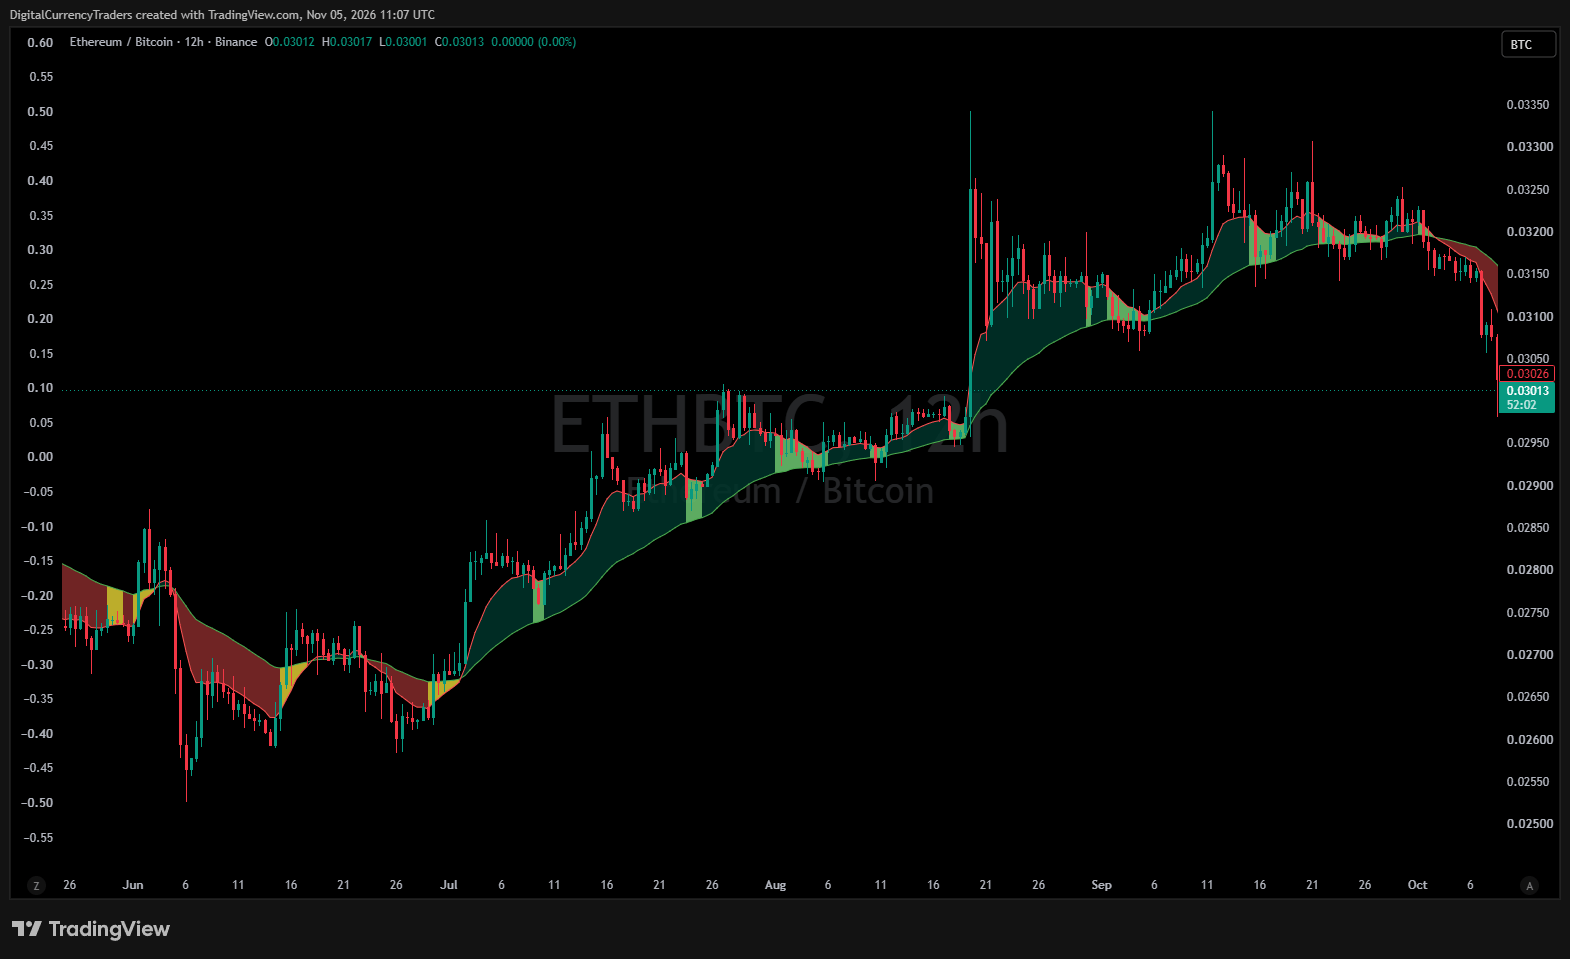
Seeing the spectrum is one thing. Acting on it is where most traders fall apart.
The AltSeason CoPilot turns each color into an action. Every trade moves through the five stages of a trade: Watch, Entry, Risk Protected, Add-On, and Exit.
Watch. A coin goes on Alert when it starts building a bottom on its ALT/BTC daily chart. Nothing gets bought yet.
Entry. A coin moves to Hold only when three signals line up: the 10/40 EMA cross, a trendline break, and a break of the 1-2-3 Point 2. One or two out of three doesn’t count.
Each entry is a small, equal slice of the account. No single coin gets the chance to hurt the portfolio.
Risk Protected. Once the trade moves in your favor, the stop comes up above the entry. Now the trade can’t do much damage.
Add-On. Only coins that prove you right get more money. That’s how the long tail gets caught: many small tries, and more size only on the winners.
Exit. When the signals cross back, the position comes off. No debate, no hoping.
Missed an entry? Let it go. Swinging the bat after the ball has crossed the plate is how you strike out.
This is Phantom of the Pits Rule #1 in action. Assume you are wrong when placing a trade, and reduce or remove your position unless it proves you correct.
And Rule #2 is the other half. Press your winners correctly, without exception.
Both rules get a full lesson in Phantom of the Pits risk control.
My $500,000 lesson
Why does all of this have to be mechanical? Because I learned the hard way what happens when it isn’t.
In 2017 my alt account grew from about $10,000 to around $150,000. I was sure the alts were just getting started.
They weren’t. Dominance had turned, and my alts were losing ground against Bitcoin, even while their dollar prices kept climbing.
I held anyway. At the top, the account peaked at about $535,000.
That sounds great until you run the other math. If I’d rotated those alts into Bitcoin when dominance turned, the same money would have been worth about $1.2 million.
I call it my $500,000 mistake. And I didn’t make it only once.
I held alts too long again in 2019. In early 2020 I ignored my own system’s exit signals one more time.
The problem wasn’t a lack of knowledge. I was avoiding the work of selling everything and buying it all back later.
That’s why the system is mechanical, and why so much of it is automated now. The signal decides, not my mood that morning.
The whole road there is in my short story.
These numbers are my own history. They aren’t typical results, and they’re no promise of anything.
Bitcoin dominance FAQ
What is Bitcoin dominance? It’s Bitcoin’s percentage share of the total crypto market value. A reading of 55% means Bitcoin makes up 55% of all crypto by market value.
Does falling Bitcoin dominance mean alt season? It means alts as a group are gaining on Bitcoin. It doesn’t tell you which alts, and most coins may still do very little.
What does it mean when dominance rises and Bitcoin falls? The alts are falling even faster than Bitcoin. That lines up with the USDT state, where cash protects the account.
Does the AltSeason CoPilot trade the dominance chart? No. The portfolio state comes from the 10/40 EMA on the BTC/USD daily chart, and each alt is judged on its own ALT/BTC daily chart.
Can Bitcoin dominance predict which coin will run next? No. Nothing can do that reliably, which is why the system holds many small positions and only adds to the ones that prove themselves.
What the prism doesn’t do
A prism doesn’t make light. It only shows you what’s already there.
The same goes for this system. It doesn’t predict where dominance goes next, and it doesn’t pick the next big winner.
It reports what each chart is doing right now. Then it applies the same rules, every single day.
So here’s a question worth sitting with.
Next time dominance moves, will you be guessing at the average, or acting on the early movers within the spectrum?
If you want to learn to read it yourself, the free course walks you through it one step at a time. Start the free AltSeason CoPilot course.
Trade safe, and keep those losses small. Cheers.
Discover more from introtocryptos.ca
Subscribe to get the latest posts sent to your email.


You must be logged in to post a comment.