
Bitcoin Price Action Analysis: Key Trading Levels for 2025
Key Takeaways:
- Bitcoin has reached critical levels that require strategic trading decisions based on technical indicators
- Our three-pool investment strategy (fiat, Bitcoin, altcoins) helps achieve annual portfolio doubling goals
- Technical analysis using RSI, MACD, Ichimoku Cloud, and Bollinger Bands shows consolidation patterns
- The Crypto Smartwatch report identifies outperforming altcoins by analyzing Bitcoin dominance trends
- Implementing a structured trading plan with clear entry/exit points is essential for crypto trading success
Bitcoin Price Action: Critical Trading Levels Revealed
Bitcoin Price Action: Critical Trading Levels
Bitcoin and the broader cryptocurrency market have reached a pivotal decision point that directly impacts our trading strategy. Current price movements require careful analysis to determine optimal positions according to our established trading framework.
- In today’s analysis, I’ll examine Bitcoin’s price chart against multiple technical indicators to identify key support and resistance levels
- I’m sharing an important announcement regarding a new collaboration that enhances our trading insights
- We’ll review recent altcoin performance data from our comprehensive Crypto Smartwatch reports and compare patterns to the 2021 alt season. Our proprietary system has identified several high-probability coins with exceptional potential, which I’ll detail at the end
Strategic Crypto Wealth Building: The Millionaire Method
Our systematic investment approach demonstrates that you can achieve millionaire status by consistently investing just $20 weekly and doubling your capital annually through strategic market positioning.
To accomplish this annual 100% return objective, we strategically allocate capital across three distinct investment pools based on market conditions:
- Fiat currency positions (during market downtrends or excessive volatility)
- Bitcoin holdings (during Bitcoin uptrend phases)
- Altcoin portfolios (during altcoin seasons when they outperform Bitcoin)
Our detailed trading plan functions as a decision flowchart, providing clear guidance on optimal capital allocation based on current market conditions. However, many traders struggle with managing profitable cryptocurrency positions, particularly knowing when to take profits or rebalance their portfolios.
I’ll address these profit-taking strategies later, but first, let’s analyze the current Bitcoin price action.
Since cryptocurrency prices continuously fluctuate, join our free Discord trading community for real-time Bitcoin analysis and trading signals that keep you ahead of market movements.
Follow me on Twitter for ongoing research and detailed analysis of top-performing crypto projects in 2025.
Let’s examine our comprehensive Bitcoin indicator dashboard to identify key action zones that align with our trading methodology.
Our proprietary Bitcoin dominance and altcoin season indicator is approaching the threshold that signals potential market exits. We apply this same analytical framework to individual crypto/BTC pairs, identifying coins consistently outperforming Bitcoin against USD.
Bitcoin Technical Analysis: Current Market Structure
The Relative Strength Index (RSI) on the daily timeframe sits precisely at our exit confirmation threshold. Zooming into the 4-hour chart reveals a consolidation pattern that necessitates heightened vigilance. I’ll compare these readings with historical RSI patterns momentarily.
The On-Balance Volume indicator presents conflicting signals, reinforcing our need to remain alert for decisive price movements in either direction before committing to position changes.
The MACD indicator aligns with RSI readings but provides more definitive confirmation signals for our next actions. Specifically, a MACD crossover represents a clearer trigger event compared to RSI trend violations.
The Ichimoku Cloud, while previously providing strong directional guidance, now presents mixed signals rather than confirming a clean breakout. This creates several action zones we’ll use as confirmation points for our trading decisions.
Bollinger Bands aren’t currently signaling reversals but are forming trend confirmation patterns that can validate signals from our other indicators. Once prices make a decisive move, we’ll monitor the Bollinger Bands for potential exhaustion signals that mark the end of breakout momentum.
Exciting Partnership Announcement
I’m thrilled to share some significant news with our trading community!
I am delighted to announce that
I’ve been invited to become a featured analyst and content contributor for Crownanalysis.com
Many followers are familiar with Tom Crown’s popular channel and its 75,000 subscribers. Tom delivers exceptional technical analysis and teaches advanced indicators I hadn’t previously incorporated into my methodology. Following Tom’s content has significantly enhanced my macroeconomic analysis skills. Visit our website for the official announcement and read my first guest post outlining 12 common reasons traders lose money – insights gained from firsthand experience with these trading pitfalls.
Developing Superior Trading Skills Through Systematic Improvement
The primary purpose behind my YouTube channel and detailed trading journals is identifying recurring trading mistakes and systematically eliminating them from my strategy. This documentation process creates accountability and measurable improvement.
Effective education isn’t about accumulating knowledge – it’s about transforming behavior and decision-making processes.
Simply understanding your trading plan’s principles isn’t sufficient. The documented trading plan framework that bridges knowledge and consistent execution is what separates successful traders from the 95% who fail.
This execution discipline forms the cornerstone of our trading community’s approach.
Crypto Smartwatch Report: Data-Driven Market Insights
Our comprehensive strategy operates across three distinct capital allocation states: fiat currency positions during downtrends, Bitcoin holdings during BTC uptrends, and altcoin investments when select cryptocurrencies demonstrably outperform Bitcoin in USD value.
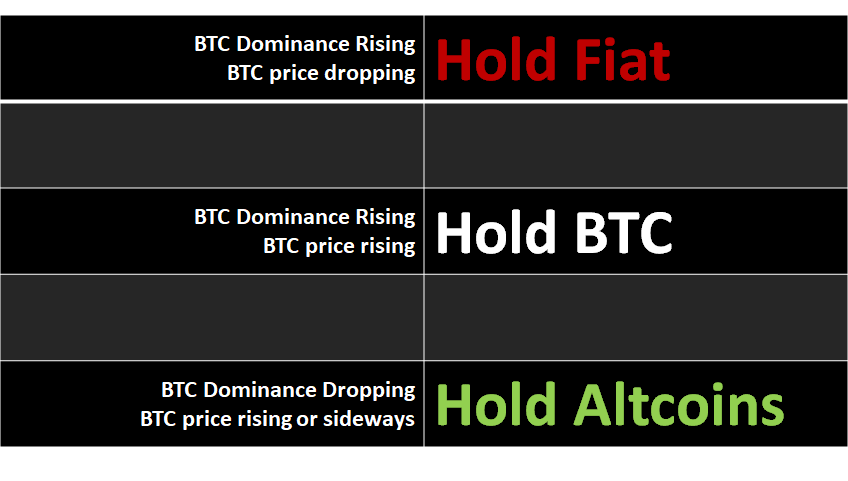
When Bitcoin dominance rises while BTC price falls, this indicates overall cryptocurrency market capitalization contraction – signaling we should prioritize cash positions to protect capital during market downturns.
The Crypto Smartwatch tool provides visibility into the individual components driving Bitcoin dominance shifts, allowing us to identify the statistical distribution of coins influencing market trends. Bitcoin dominance represents a market-wide average, while Crypto Smartwatch identifies the outperforming leaders within this distribution curve.
By tracking alt/BTC pair performance against our trading system thresholds across 300+ cryptocurrencies, we reveal trends that remain invisible when only monitoring Bitcoin dominance as an isolated metric.
This data filtering produces a focused list of cryptocurrencies crossing key performance thresholds, transforming the complex task of optimizing your crypto portfolio allocation into a straightforward daily process that even beginner traders can implement with confidence.