Tag: zeiiermantrading

  • Candlesticks Will NEVER Look the Same Again! 🤯 | Arithmetic Candles (Zeiierman)

    Candlesticks Will NEVER Look the Same Again! 🤯 | Arithmetic Candles (Zeiierman)

    Candlesticks Unveiled: The Secret That Will Transform Your Trading!

    Could a simple shift in perspective unlock a whole new dimension in understanding market movements? Imagine seeing the true power of price action, unclouded by traditional chart biases. The revelation shared by Zeiierman Trading promises to fundamentally change how you interpret candlestick charts, revealing hidden insights and preparing you for what’s next.

    This isn’t just about looking at charts; it’s about seeing the rhythm of the market in a way that aligns with how prices actually move. Your understanding of market dynamics is about to be upgraded, offering a clearer lens through which to view opportunities.

    The traditional methods, while foundational, often obscure a crucial truth, and it’s time to pull back the curtain.

    The Core Driver: Arithmetic Candles

    The biggest innovation Zeiierman introduces is the concept of “arithmetic candles.” Unlike the common logarithmic scale that distorts price movements, arithmetic candles offer a true, linear representation of price change. This subtle yet profound difference is the key to unlocking better market analysis.

    Think of it like this: are you watching a horse race where some horses are artificially handicapped, or one where every stride is measured equally? Arithmetic candles ensure every price increment carries its true weight, reflecting the raw, unbiased market sentiment. This is a game-changer for anyone trying to decipher genuine price action from noise.

    The Hidden Truth of Price

    Traditional logarithmic charts, while useful for long-term trends, inherently warp the perception of price volatility, especially at lower price points. A 10% move on a $1 asset looks dramatically different from a 10% move on a $100 asset, even though the percentage change is identical.

    This can lead to misinterpretations and missed opportunities.

    Arithmetic scales, however, present every price difference with equal visual emphasis, regardless of the asset’s current value. This linearity helps identify true support and resistance levels more clearly, as well as significant price action patterns that might otherwise be obscured. Historical price patterns, when viewed through this undistorted lens, reveal clearer and more reliable signals.

    What to Look For

    With arithmetic candles, several key indicators take on new meaning and clarity.

    ➤ First, volume analysis becomes more potent, as sustained volume on an arithmetic chart truly reflects persistent buying or selling pressure, free from the visual distortion of price scaling.

    ➤ Second, breakout patterns become undeniable; obvious shifts in price levels are no longer understated by a logarithmic scale.

    ➤ Third, the concept of “range” becomes more intuitive. When market participants are trading within a clear arithmetic range, it offers crisp entry and exit points, indicating when the market is truly consolidating before a significant move. These simple signals, amplified by arithmetic scaling, provide powerful insights into market intent.

    Your Analytical Edge:

    Understanding arithmetic candles gives you a powerful advantage in an often-crowded market. This fundamental shift in visualizing price action empowers you to:

    * **Spot clearer support and resistance:** Identify genuine price levels where buying or selling interest is concentrated.
    * **Decipher true volatility:** Understand when a price move genuinely indicates significant market sentiment, rather than just appearing large on a traditional chart.
    * **Improve entry and exit points:** Make more informed decisions based on undistorted price action, leading to potentially better trade outcomes.
    * **Enhance pattern recognition:** Identify classic chart patterns with greater precision, as their geometric integrity is preserved.

    This knowledge isn’t just theoretical; it’s a practical tool to sharpen your market analysis and execution.

    It’s about seeing the market as it truly is, rather than through a convenient but often misleading lens.

    Beyond the Basics

    The insights gained from arithmetic candles extend beyond just individual asset analysis. This perspective can be applied to understanding market sectors, identifying which assets are truly leading or lagging based on real price movement, not just percentage swings. Furthermore, it aids in understanding the “relative strength” of different assets, showing which ones are attracting or losing real capital flow.

    By appreciating the linear nature of price, you can also better assess the impact of large institutional orders. These orders move specific price points, and an arithmetic scale provides a truer visual representation of their influence on market structure, offering cues for where the “smart money” is positioning itself.

    A Balanced Perspective

    While arithmetic candles offer a clearer view, the market remains inherently unpredictable. This tool refines your perception, but it doesn’t guarantee outcomes. Always combine this analytical framework with sound risk management principles, setting stop losses and managing your position sizes carefully.

    The immediate adoption of this strategy may feel like a leap, but the long-term benefits in clarity and insight are substantial.

    The market sometimes offers these profound yet simple revelations, opportunities to refine your approach and see things anew. The time to integrate such powerful insights is now, before they become conventional knowledge.

    The traditional candlestick chart, as you know it, might be subtly misleading you. Are you ready to see the market through a lens that reveals its true arithmetic heartbeat?

    Don’t let this opportunity to fundamentally enhance your trading understanding pass you by.

    The window to gain this edge, while powerful, is only truly open for those who act to learn and adapt now.

    For a deeper dive into this transformative concept and to learn directly from the expert, make sure to watch the full video:

    [Candlesticks Will NEVER Look the Same Again! 🤯 | Arithmetic Candles (Zeiierman)]

    You can also explore more educational resources from the author by visiting [Zeiierman Trading]
  • The Clock is Ticking: Why Bitcoin’s Next Move Could Define Your Portfolio

    The Clock is Ticking: Why Bitcoin’s Next Move Could Define Your Portfolio

    The crypto market is buzzing with anticipation, a low hum that suggests something significant is brewing under the surface. If you’ve been watching Bitcoin, you’re not alone, and understanding its current consolidation could be the key to unlocking substantial opportunities.

    This isn’t just another lull; it’s a strategic pause, a coiled spring before a potentially explosive move that could redefine capital allocation in the coming months.

    video below

    Bitcoin’s Measured Ascent

    Bitcoin has entered a classic consolidation pattern, a period of sideways movement after a significant upward thrust. This behavior isn’t random; it’s a healthy and often necessary phase in a bull market, allowing the asset to digest gains and build a stronger foundation. Think of it like a marathon runner catching their breath before the next powerful surge.

    This current consolidation is happening in a particularly interesting range, just below its all-time high, painting a picture of underlying strength rather than weakness.

    A Dance with History

    Comparing today’s market to past cycles reveals some striking similarities and crucial differences. Historically, these consolidation phases have preceded significant breakouts, often with Bitcoin breaking its previous all-time high and entering a parabolic run. This time, however, the landscape is subtly altered.

    The institutional adoption, the introduction of spot ETFs, and the increasing mainstream acceptance all suggest a more mature, yet still highly dynamic, market.

    While the “new money” might see this as hesitation, seasoned observers recognize it as a deliberate recalibration, a preparation for what’s next.

    Signals from the Chart

    Several key indicators are flashing green,
    suggesting that this consolidation phase is nearing its end. One critical signal is the tightening trading range, indicating reduced volatility and a build-up of pressure. This compression often precedes a decisive move.

    Another compelling piece of evidence comes from on-chain metrics, which show continued accumulation by long-term holders. These “smart money” players are not selling into strength; they are actively increasing their positions, a strong vote of confidence in Bitcoin’s future price action. Furthermore, trading volumes have remained robust, even during this consolidation, suggesting healthy interest rather than waning enthusiasm.

    ### What This Means For You: Navigating the Opportunity Highway

    This period demands a strategic approach, not a reactive one. Here’s what you should consider:

    * **Review Your Holdings:** Assess whether your portfolio is adequately positioned for a potential breakout.
    * **Consider Dollar-Cost Averaging:** Continue to accumulate strategically during this period of price stability.
    * **Identify Altcoin Exposure:** While Bitcoin leads, a breakout often signals a broader market rally, bringing altcoins along for the ride.
    * **Develop an Exit Strategy:** Plan your targets and triggers, ensuring you capitalize on potential gains without being swept away by euphoria.

    This isn’t about blind speculation; it’s about informed positioning, understanding that the current calm might simply be a prelude to the storm.

    Beyond the King

    While Bitcoin takes center stage, its movements often create ripple effects across the entire crypto ecosystem. During a Bitcoin-led rally, well-established altcoins with strong fundamentals and innovative solutions are often the next to see significant price appreciation. These can offer amplified returns for those willing to take on additional risk.

    Look for projects with proven utility, active development, and growing communities. Their performance is often correlated with Bitcoin’s strength, albeit with higher volatility.

    Balancing Caution with Conviction

    Every opportunity carries risk, and the crypto market is no exception. While the outlook is overwhelmingly optimistic, unexpected macroeconomic shifts or regulatory hurdles could introduce short-term volatility. Maintaining a diversified portfolio and only investing what you can afford to lose remains paramount.

    However, the current confluence of technical patterns, market sentiment, and institutional interest suggests that the window for optimal positioning might be narrowing. This isn’t a market that waits indefinitely; it rewards those who anticipate and act. Don’t let indecision costly.

    The stage is set, the audience is waiting, and Bitcoin appears ready for its next act.

    Are you positioned to capitalize on what could be one of the most defining moves of this market cycle? The next few weeks could prove pivotal, so make sure you’re ready before the window of opportunity closes.

    For a deeper dive into these indicators and to gain an edge, explore the advanced insights offered by Zeiierman Trading.

    Watch “Unlock Full Access to 80+ Premium Indicators 🚀 | Zeiierman Trading” here

  • The Wave Trend Indicator on Steroids! 🚀 | Dynamic Wave Trend (Zeiierman)

    The Wave Trend Indicator on Steroids! 🚀 | Dynamic Wave Trend (Zeiierman)

    Unlocking Hidden Market Reversals: The “Wave Trend on Steroids” You Need Now!

    The crypto market always seems to move in mysterious ways, leaving many investors feeling like they’re playing a rigged game. What if there was a powerful tool that could cut through the noise, revealing potential market reversals before they become headline news?

    A proprietary indicator, aptly nicknamed “The Wave Trend Indicator on Steroids,” is currently offering traders an unparalleled edge, pinpointing critical moments when market sentiment is poised to shift dramatically.

    This isn’t just another pretty chart; it’s a dynamic roadmap to recognizing explosive opportunities and navigating volatile terrains.

    link to video below

    This powerful new approach to market analysis combines the tried-and-true principles of the Wave Trend with a revolutionary dynamism, making it supremely responsive to even the most subtle market shifts.

    Imagine having a crystal ball that doesn’t just show you where the market has been, but actively hints at where it’s going next. This indicator is built to highlight crucial oversold and overbought conditions, areas where retail investors often make predictable mistakes, but where informed traders can find their greatest wins.

    Deciphering Market Sentiment: The Invisible Hand at Play

    Understanding market sentiment is like reading the collective mind of millions of investors – a task that often feels impossible.

    However, this enhanced Wave Trend breaks down complex price action into clear, actionable signals.

    It visualizes the underlying buying and selling pressure with remarkable clarity, acting as a direct window into the market’s true intentions.

    Traditional indicators often lag, providing insights after the opportune moment has passed. But this “steroid” version of the Wave Trend is designed for real-time relevance, helping you cut through the noise of daily market fluctuations. It helps to quickly differentiate between fleeting momentum and genuine, high-conviction reversals.

    This dynamic responsiveness is what separates successful traders from those who are always a step behind.

    Spotting the “Sweet Spots”: From Oversold to Overbought

    Every market cycle presents opportunities, but knowing *when* to capitalize on them is the real challenge. This cutting-edge indicator excels at identifying those crucial “sweet spots” where assets are either deeply oversold and ripe for a bounce, or dangerously overbought and due for a correction. It visualizes these extremes with stark clarity, presenting a compelling narrative of market exhaustion and potential turning points.

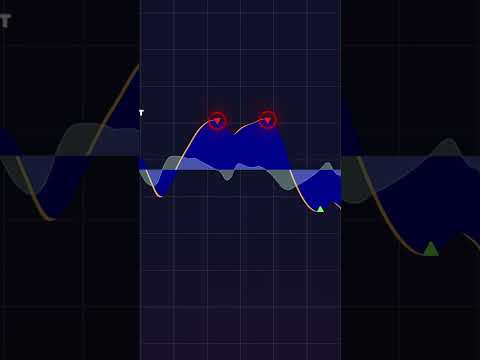
    For example, when the indicator plummets into the deeply oversold territory, it signals that selling pressure has likely reached its peak, paving the way for a strong buying opportunity. Conversely, when it soars into the overbought zone, it warns that the upward momentum might be unsustainable, suggesting a strategic moment to consider profit-taking. These insights allow for more calculated decisions, moving away from emotional reactions and towards strategic foresight.

    Your Tactical Advantage: Navigating Volatility with Precision

    In today’s fast-paced crypto landscape, a tactical advantage is not just helpful; it’s essential. This dynamic Wave Trend indicator provides that edge by distilling complex market data into easily digestible visual cues. It empowers you to see beyond the surface-level price action and identify the hidden currents that drive significant market movements.

    What this means for you is the ability to anticipate bullish divergences that hint at an impending upward trend, or spot bearish divergences that warn of a potential downturn. These early signals are invaluable, allowing you to position yourself strategically before the crowd rushes in. It’s about playing chess, not checkers, in the ever-evolving game of market dynamics.

    Ready to Unleash the Power of Dynamic Analysis?

    The market is an ever-moving beast, and staying ahead requires tools that are just as dynamic.

    This “Wave Trend Indicator on Steroids” is not just an upgrade; it’s a paradigm shift in how you can approach market analysis, offering precision and foresight that was previously out of reach.

    Are you prepared to harness this power and transform your trading strategy?

    Don’t let valuable opportunities slip through your fingers while others are capitalizing on them. The insights provided by this advanced indicator are a game-changer, but understanding its full potential requires seeing it in action. Be sure to watch the full video to truly grasp the profound impact it can have on your trading approach. Don’t miss out on leveling up your market analysis expertise and unlocking these powerful new strategies.

    ➤➤ To see the full power of this indicator and learn more about its incredible potential, watch the complete video:
    The Wave Trend Indicator on Steroids! 🚀 | Dynamic Wave Trend (Zeiierman)

    For those eager to delve deeper into these advanced trading techniques and learn directly from the expert behind them, additional resources are available to further enhance your understanding and trading skills at: Zeiierman Trading. 👈

    Don’t let the window of opportunity close; equip yourself with the knowledge to thrive in any market condition.

  • The Order Block Hack Institutions Use (Now Automated!) 🔥 | Multi-Timeframe Smart Money Tool

    The Order Block Hack Institutions Use (Now Automated!) 🔥 | Multi-Timeframe Smart Money Tool

    ## Unlock Institutional Secrets: My Shocking Discovery That’s Changing My Trading!

    You’re about to uncover something truly groundbreaking, something that could fundamentally alter how you approach the markets forever.

    Imagine gaining an unfair advantage, accessing the same powerful tools that institutions leverage, but without their huge budgets or insider connections.

    I’m talking about a method that’s finally within your reach, and trust me, your trading will never be the same.

    Link to video below

    The benefits are staggering: clearer entry and exit points, reduced emotional trading, and a tangible edge that most retail traders only dream of.

    I stumbled upon this gem, and I knew I had to share my excitement with you. It’s a tool that automates complex analysis, presenting opportunities that were once hidden to all but the elite.

    My journey to finding this has been a long one, filled with countless hours of research and frustration. I’ve always been fascinated by how the big players operate, how they manipulate markets and leave everyday traders in the dust.

    My quest was simple: find a way to level the playing field.

    And then, I found it.

    A method so elegant, yet so powerful, that I honestly couldn’t believe it existed. It’s all about something called “Order Blocks” – those invisible footprints left by institutional money.

    Understanding them is one thing, but knowing how to consistently profit from them, that’s the holy grail.

    What if I told you there’s a way to not only identify these crucial zones but to have them automatically pinpointed on your charts, across multiple timeframes, with mind-bending accuracy? This isn’t just about spotting them; it’s about capitalizing on them.

    This tool literally removes the guesswork, showing you exactly where the smart money is likely to make its next move.

    The sheer power of this automation is what blew me away. No more staring at charts for hours, trying to manually draw lines and guess intentions. This does the heavy lifting for you, presenting clear, actionable insights in real-time. It’s like having an institutional analyst whispering trade ideas directly into your ear.

    But here’s the kicker: this isn’t some complex, impossible-to-understand algorithm. It’s built on principles that, once understood, make perfect sense, revealing the true dynamics of the market. I’ve seen it in action, and the results speak for themselves.

    I’ve put together a short video that reveals this incredible discovery. You *have* to see it for yourself to truly grasp its potential. It’s a quick watch, but the insights you’ll gain are priceless.

    ➤ Don’t miss out on what could be the biggest game-changer in your trading career. Click here to watch the shocking revelation that’s powering trades!

    And if you’re serious about taking your trading to the next level, you can learn directly from the creator of this genius at their official page. 👈