BITCOIN ACTION levels
BITCOIN ACTION levels
Bitcoin and cryptocurrencies have come to a critical level for our trading plan
- in today’s video I’ll review the price chart of Bitcoin against our technical indicators
- I have a super exciting announcement to make
- and will see what has changed in altcoins over the past few days. I’ll reveal some inside data from the crypto Smartwatch reports and patterns through 2021 crypto alt season. Our system has sorted out the top probability coins as I’ll explain at the end of the video
Become A Crypto Millionaire
The promise of our overall approach is that you can become a millionaire if you invest just $20 per week and double your money every year.
In order to double our money every year we follow three different pools where our money is placed
- we can be holding fiat currency
- we can’t be holding bitcoin
- or we can be holding cryptocurrencies
Our written trading plan is very specific. It works like a flowchart to answer all the questions that you need to determine where your money should be according to our trading plan, but there’s still a question about what to do with our cryptocurrencies that are profitable.
I’ll talk about that later in the video but first let’s jump into Bitcoin prices.
Of course, before this video was finished the prices are going to change so if you want to keep up on the current analysis of Bitcoin price be sure to join our free Discord chat community
Follow me on Twitter for more research and articles on the top crypto projects of 2023.
Let’s take a look at our indicator set for Bitcoin to layout some action zones we must pay attention to according to our trading plan.
You can see our altseason indicator is on the edge of telling us to exit this Market. We use this same indicator on each of the crypto versus BTC pairs to help us identify those coins that are outperforming Bitcoin versus US dollar.
Bitcoin Technical Analysis for March 2 2023
The relative strength index is right on the threshold of our exit confirmation when we look at the daily chart, yet as we zoom into the 4-Hour chart we can also see a consolidation that raises a question and leaves us on high alert I’ll come back to some historical views on the RSI in a minute.
Moving to the volume profile the on balance volume is also a mixed signal that keeps us on notice that we’ll be taking action one side or the other as prices find a direction from here.
The macd indicator is similar to the RSI reading yet it gives us more clear specifics for confirming our next action from the price move from here, for example the crossover of the MACD is a more clear event than the trend breach in the RSI.
The ichimoku cloud was a favorite from the last video I did yet it is not confirming a nice Breakout, instead it has gone to a mixed reading that leaves us with no answer Only some action zones for us to use as confirmations.
The Bollinger Bands are not giving us any reversal signals, yet they are starting to consolidate into Trend confirmation patterns and we can gain confidence in the signals from the other indicators as the Bollinger Bands confirm. Once we get a strong move in price we’ll watch the Bollinger Bands to look for the exhaustion of that breakout move.
Special Announcement
Now for the special announcement I’m so excited about!
I am super stoked to announce that
I’ve been invited to be a guest blogger on Crownanalysis.com
Many of you already know about the channel Tom Crown. He has 75,000 subscribers and does a phenomenal job with his technical analysis and his instruction on how to use indicators that I am not familiar with. I’ve learned a lot about reading the macroeconomic conditions by following and listening to Tom Crown. Check out the news release posting on our website, and read one of my first guest blog posts there outlining the 12 reasons why people lose money Trading. (It’s a great article because I am so familiar with each of these reasons for losing money.)
Becoming A Better Trader
The purpose of my YouTube channel and my trading journals is so that I can identify my trading mistakes and avoid them in the future.
Education isn’t about knowledge, education is about changing your behavior.
Knowing about your trading plan isn’t enough. there is a secret ingredient between knowing and doing.
That’s what the focus of our community is really about.
Now for the Crypto Smartwatch Report
There are three states to our strategy, one is to hold Fiat the other is to hold Bitcoin and the other is to hold cryptocurrencies when the cryptocurrencies are outperforming Bitcoin in US dollar value.
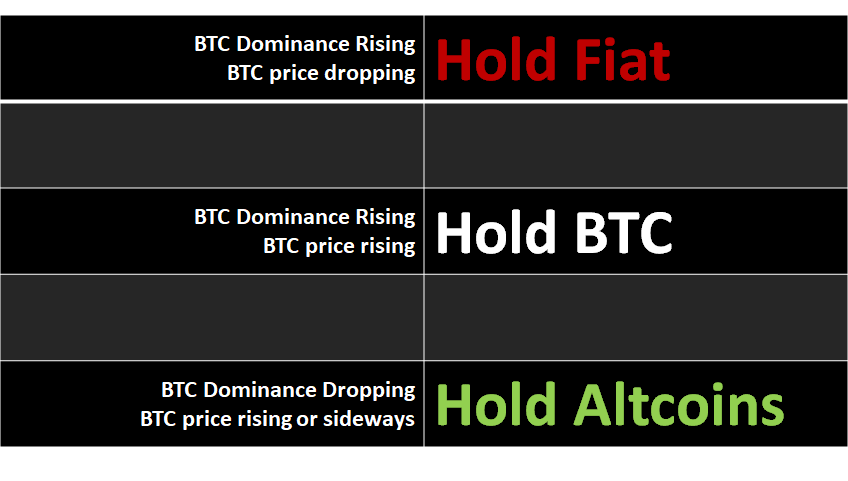
If Bitcoin dominance is rising while Bitcoin prices dropping that’s telling us that the market cap of cryptocurrency overall is declining and that we should be in cash.
The crypto Smartwatch lets us look inside Bitcoin dominance so that we can see the bell curve of the coins that are making the changes happen in Bitcoin dominance. Bitcoin dominance is an average of all of the coins, and the crypto Smartwatch helps us find the leaders in that bell curve.
As we plot the performance of the alt versus BTC pairs over time versus the thresholds of our trading system averaged out across the entire list of 300 cryptocurrencies.
We can begin to see trends that are invisible when we only look at Bitcoin dominance – And we can also filter a list of coins that are passing key thresholds, making our job of rebalancing our crypto portfolio into a simple daily task that anyone can follow.