Video Chapters
- 0:00 Bitcoin Price today
- 0:30 Bitcoin TA
- 3:26 Saturday’s Signal
- 6:02 AltSeason 2023 Update
- 8:20 Crypto Signal Results
In today’s video I reveal how I captured a entry signal on Saturday mornings Bitcoin Breakout
Before I do that let’s check through the relative strength index, the on balance volume, the macd indicator, the ichimoku cloud and finally the Bollinger Bands
By following these indicators on the 4-Hour and the daily time frame we can watch for our trading signal to appear and follow along as our trading system risk control rules are applied
The important part of this video
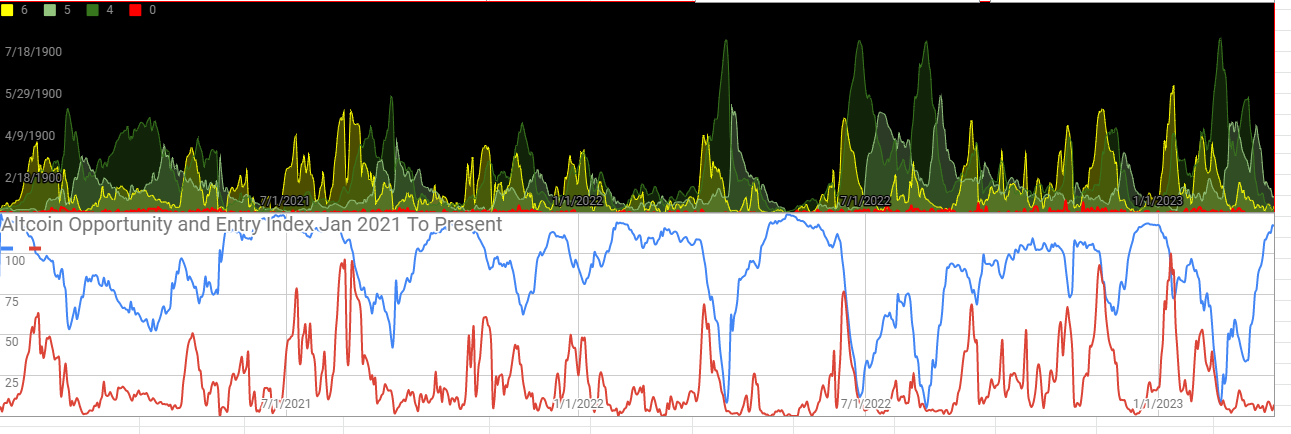
is after about the 7 Minute Mark where I detail the historical data from our altcoin season research. We can show that there have only been six opportunities in the past that match what we are looking at right now. In those six past opportunities if we had deployed our altcoin strategy at that time we would have pulled profits out of the markets.
I don’t know the future but because our trading system is down to a very unique pattern. I do know it is an important time to watch each individual coin that is passing our trading signal.
With a simple daily routine, we can slowly build out our crypto portfolio and diversify into the most promising projects.
As a cryptocurrency trader, capturing a profitable entry signal is the first step in your trading success. In this video, I will share with you how I captured a Bitcoin breakout entry signal on Saturday morning, including the indicators, the chart patterns and the risk management I used for planning this signal.
Analyzing Indicators
Before I reveal my trading signal, let’s take a look at the indicators I used to make this trade. I analyzed the relative strength index (RSI), on-balance volume (OBV), moving average convergence divergence (MACD), Ichimoku cloud, and Bollinger Bands. Analyzing these indicators on both the 4-hour and daily time frames allowed me to get a clear picture of market trends and potential trading signals.
Trading System Risk Control Rules
After following the indicators and analyzing the market trends, I was lucky to be there when my trading signal appeared.
I applied my trading system risk control rules and left my money there to watch the market and make my trade.
The set of rules we have in place to manage risk
are more important than our price predictions.
Historical Data Analysis
In this video, I revealed historical data from our altcoin season research.
After analyzing the data, I discovered that there were only six past opportunities that matched what we were looking at right now in March of 2023.
If we had deployed our altcoin strategy during those six opportunities, we would have been able to pull profits out of the markets.
Trading System Unique Pattern
While I cannot predict the future, I do know that my trading system is down to a very unique pattern, making it an important time to watch each individual coin that is passing our trading signal.
Daily Routine for Crypto Portfolio
By incorporating a simple daily routine, we can slowly build out our crypto portfolio and diversify into the most promising projects. It is important to continuously analyze market trends and adjust our strategies accordingly.
Capturing a profitable entry signal requires careful analysis of market indicators and a solid trading system with risk control rules in place. By following these practices and incorporating a daily routine, we can increase our chances of success in the volatile cryptocurrency market.
Bitcoin Consolidates Under Reversal Hammer Candle Bitcoin Breakout Entry Signal