Here’s were we are Now:
We may be at the foothills of a profound bull market now. And we are not just looking for bottom formations – most of that work is done unless prices break through recent lows in many coins…
We have our alerts all set, we are ready to play a trade. We have identified chart patterns, entry and exit targets, our emergency stop area all planned in advance. Once the alert has been triggered and buy our position – at the start of each trade we are on guard with Rule #1, if price prove us correct, and we can move our stop above our entry price, the we can relax mostly.
Stage One of a trade:
Identify the chart patterns, set up entry, exit and stops, take a screenshot.
Alert price is triggered – direct attention on the price of this new trade – assume the trade entry is wrong, prepare for a fakeout breakout and that prices may spike and come back within a short time. Continually evaluate the trade – if you are not correct, reduce or remove the position.
Proven correct – stage one – once prices rise a couple percentage points from the entry, move the stop loss closer to, or above the entry price to give hands-free Rule #1 activation if prices retest.
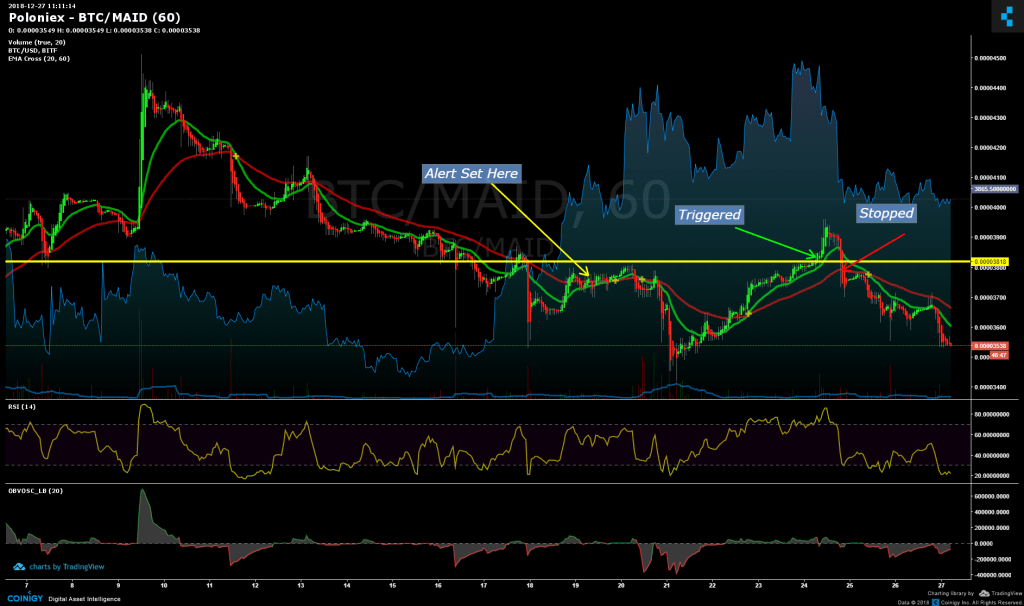
Here is an example of a failed trade signal with losses taken correctly.
https://www.coinigy.com/s/i/5c24b35239f5e/
The alert was placed on December 3 and activated December 23 – and prices moved in our favor for the first few hours, but within ten hours prices had retraced and sharply dropped below our entry level. Ideally, Rule #1 would have kicked us out of this trade at that moment.
Stage Two
- Trading for the trend, not the waves.
After the trade is profitable and the stop is just above the entry point, this method of trade management will keep stop losses back away from the markets and let them have room to swing to their 50% levels, + or -, depending on technical levels.
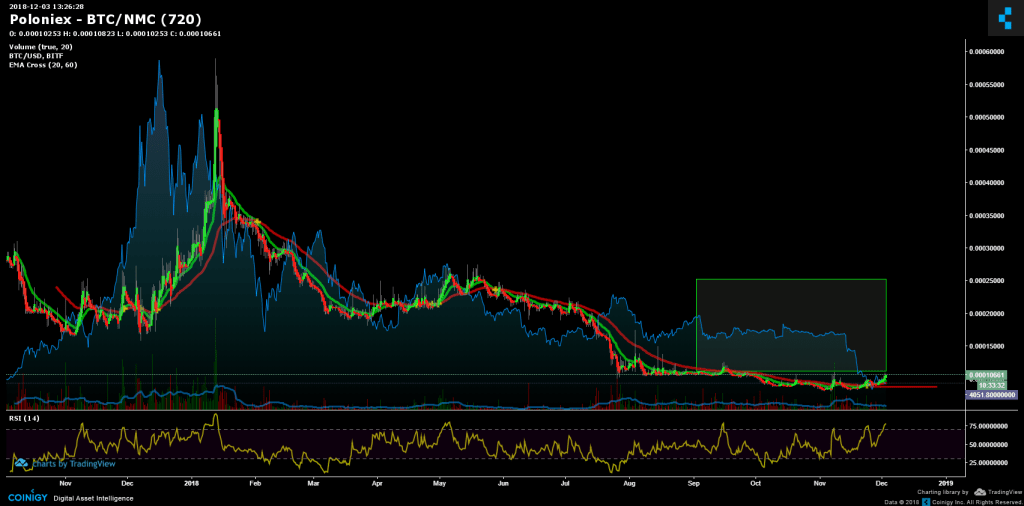
For example, our recent trade in NMC (Namecoin). The alert was posted Dec 3 and was activated soon after.
Moving Into Stage 3
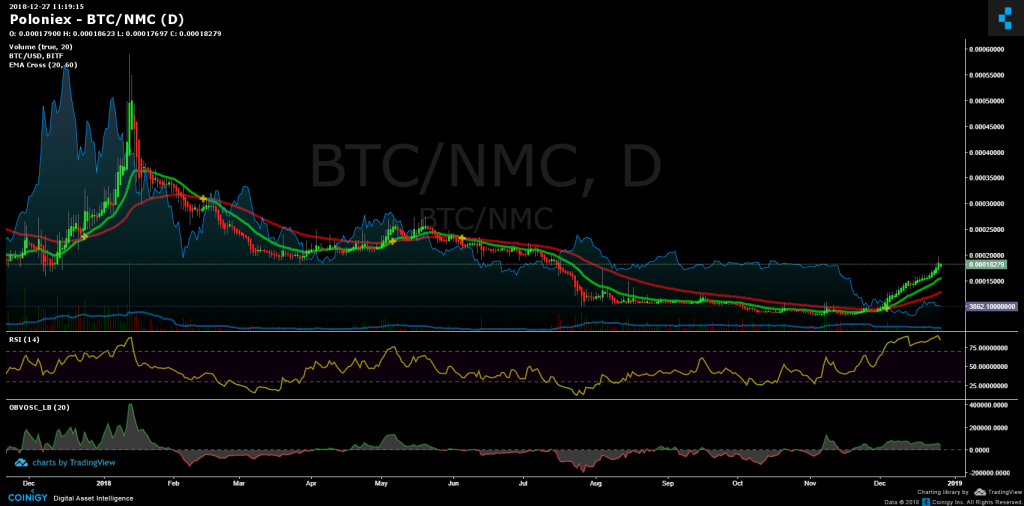
Here is a chart after three weeks of holding the position, now up 63%
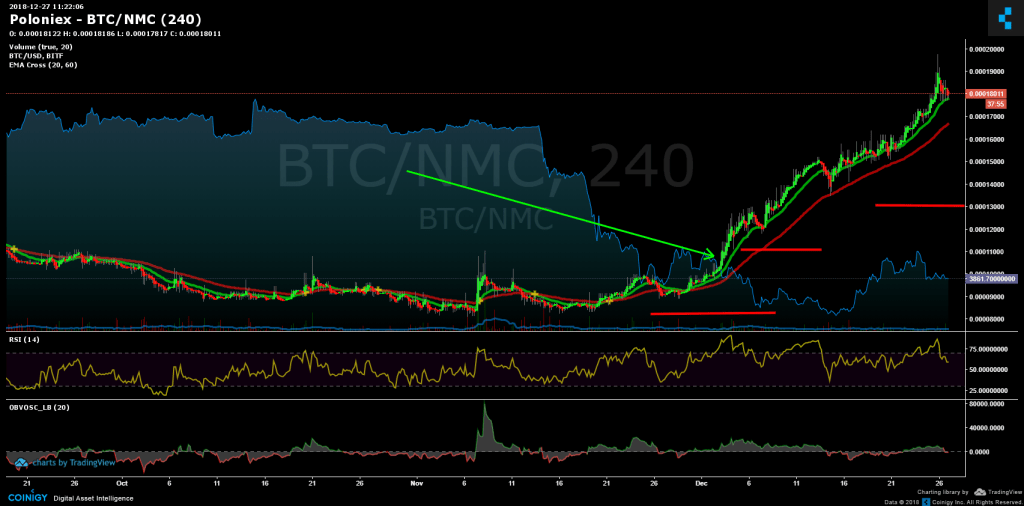
With a closer view of where the stoploss is set:
While the NMC trade us showing unrealize profit of 63%, the stop was moved up a second time and now locks in about 20% gains. We are willing to risk more money with our profits to have the chance of staying in the trend for it’s full move.
Now that we have a profitable position, there is no risk and no troubles of trying to find yet another entry into this market. We want to hold our position, and so the risk expectation is different in this stage of holding a trend trade.
We may now be in the earliest stages of the bull trend, the foothills before the mountains. We cannot see beyond the clouds to know how high these mountains cliffs may be.
Seeking Stage 4 Of The Trade
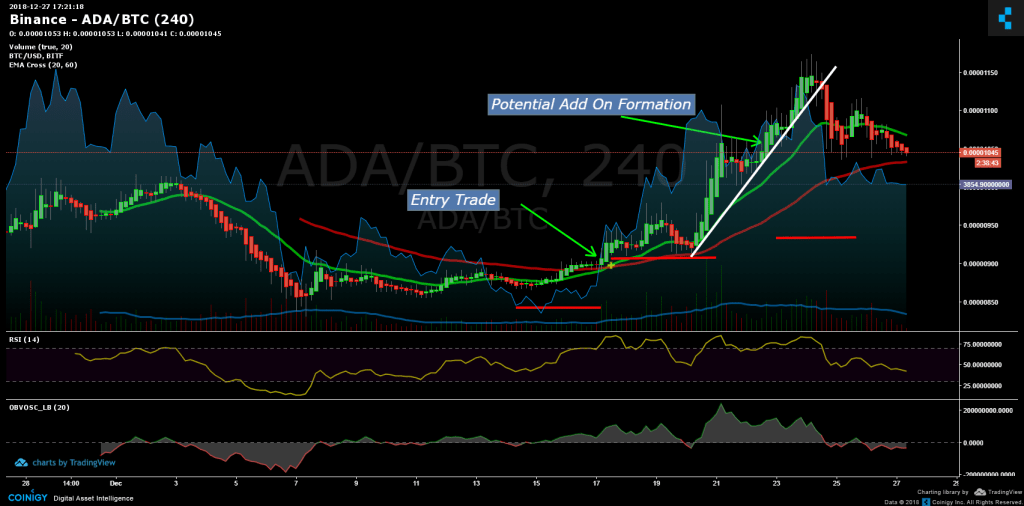
The pull back and place to add on
After Factom went from 50000 sats to 500000 sats in a month (yes, that is a 10x move), prices have retraced to the 50% level, and have made a couple consolidations with indications of forming a trend continuation pattern.
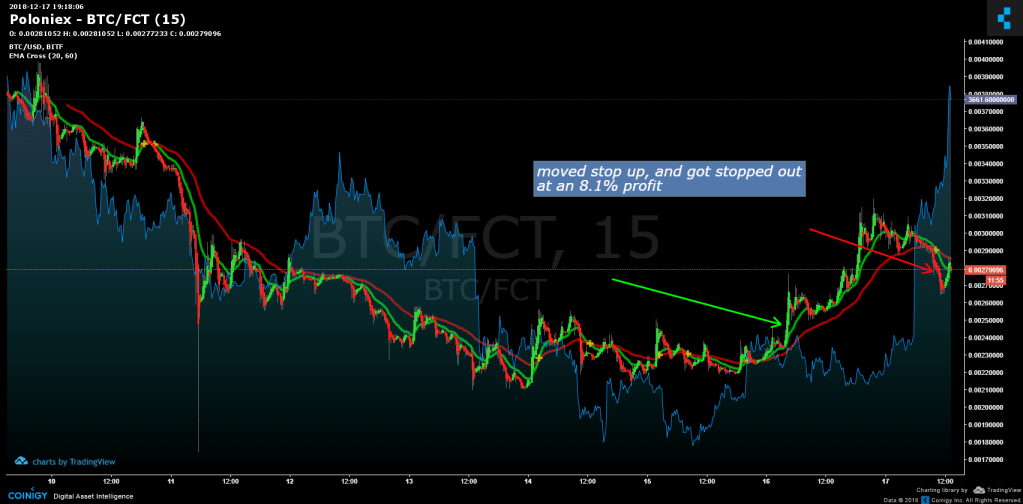
We caught one of these patterns so far, and used the stop loss well for an 8% profit. Now prices are shaping up with another potential continuation pattern in the works:
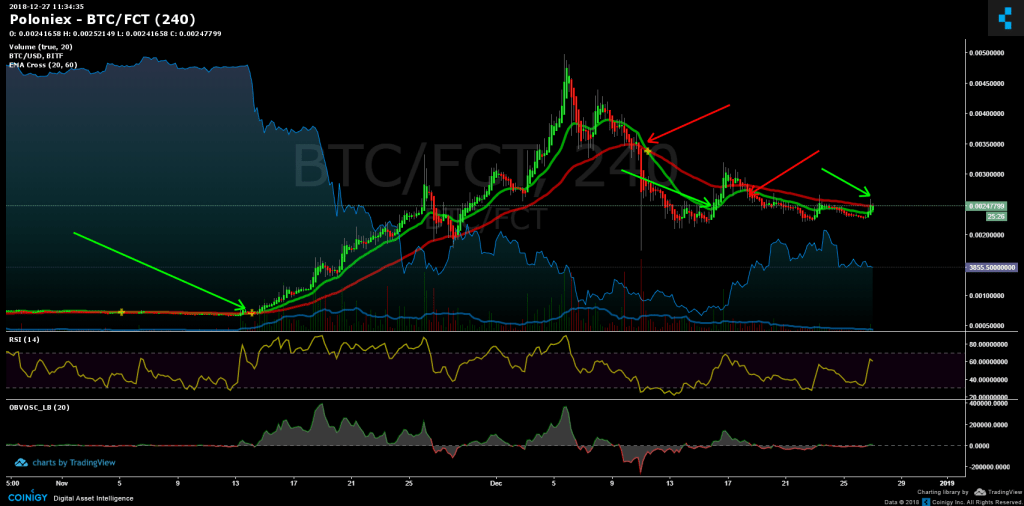
Important perspective, in anticipating a 12 to 18 month bull market run, we can also expect a surge and pull back to take from 6 to 12 weeks as we have seen here in Factum prices from November 14 until December 27 2018.
This same time frame will be played out for each of four or five waves – perhaps culminating in late December 2020… (When we look back, it will turn out to have been classic Elliot wave bull market patterns.)
Trend Trading Stop Strategy Example 2
- Our entry pattern
https://www.coinigy.com/s/i/5c12613e86bc8/
After an nice move from our entry target, prices have made a top and are now forming a big descending wedge, bearish RSI, weaker OBV – but – I’m not moving my stop up. We had a great entry and I want to keep this position instead of jumping in and out on every wave. Getting a nice clean entry on a trade is a challenge. And I want to hold this. I am willing to keep my stop loss below the 38% fibonacci, thus risking the unrealized gains for the chance to hold past a dip for much, much greater moves over the next months.
https://www.coinigy.com/s/i/5c250a0ef1b09/
The end of the trend – top formations in all sizes
When to take profits is ranked at the top of difficulties for traders surveyed. It may be because you are putting an all or nothing approach into it, rather than scaling out of your position the same way we scale in with Rule #2
Taking action on a top formation is similar to trading a bottom formation, but the three indicators are used in a different order.
We are alerted of an impending top formation by a weakening RSI divergence and declining On Balance Volume Oscillator readings at the same time as the 1-2-3 or double top formation. In the top formation, breach of the trendline at the 1-2-3 top is the first layer action trigger, and the EMA crossover would be for closing the remainder of the position.
Descending Wedge or Head and Shoulders Top?
There are many instances where an ambiguous trading pattern is working its way out. We may be able to draw a bullish descending wedge, and at the same time identify a potential head and shoulder stop formation in the same chart.