The common trend reversal pattern is a very powerful tool, but it is wrong as often as it is correct when used as a solitary trading signal. However, the trend reversal patterns effectiveness becomes far greater when filtered by requiring a moving average crossover and a trend line break at the same time as the technical reversal pattern – for the trading signal to occur.
These three trading tools work together in any time frame. They can be used in conjunction with daily and weekly charts for long-term trend-following, and they can be used together with five minute and one minute bars for Day Trading.
Trendline Break Alert
A trendline can be drawn by connecting the recent top prices to draw a line with a slope, and trendlines can be drawn by connecting the recent low prices to draw a line with a slope. When prices no longer follow along the recent trendlines, this is a signal to prepare for a position.
The trendline break generally occurs at the earliest stages of the 1-2-3 bottom formation.
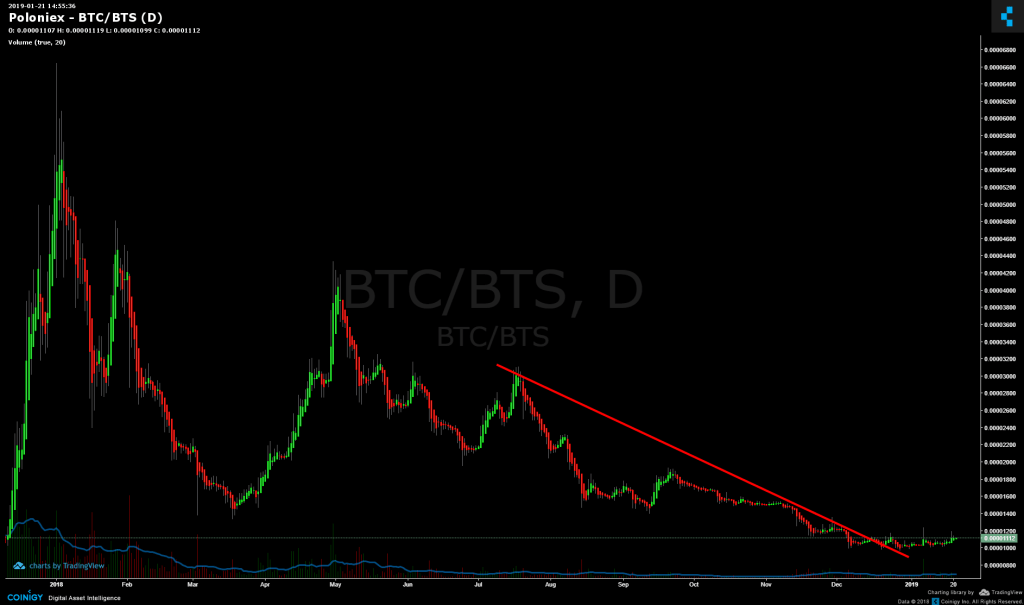
Using Trendlines in Bottom Formations
The break of the down trendline is the early warning stage that a bottom formation may be imminent. As we are coming out of a down trending market and finding the first tests of the lowest price. The break of the down trendline is not a trading action signal.
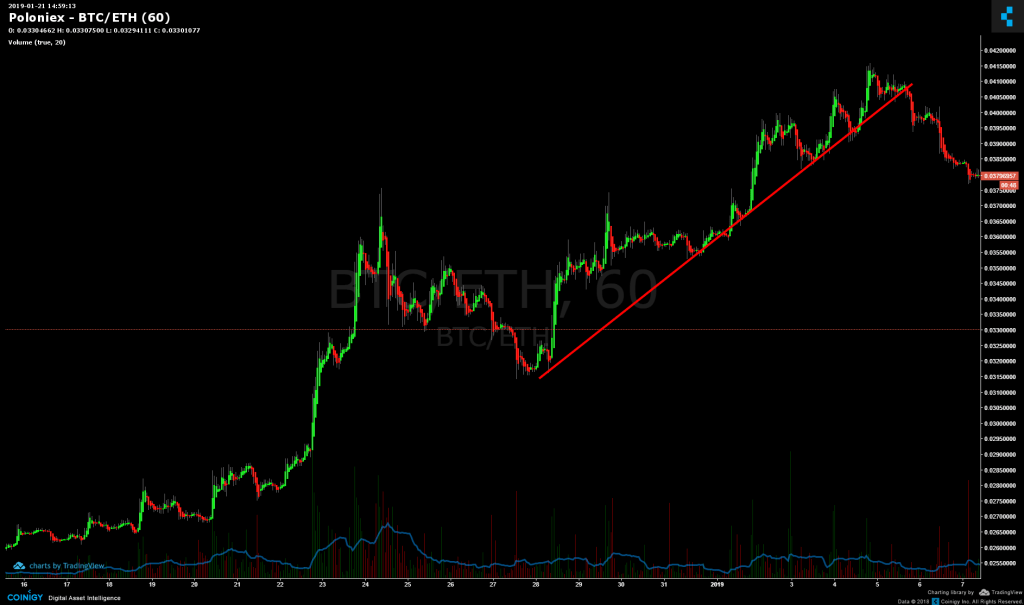
Using Trendlines For Top Formations
The breach of an uptrendline can be the final step required to trigger a sell trading action – either to close a long position, or to take a leveraged short position. These visual examples will help form pattern recognition, and later in a tutorial video, we’ll deepen your recognition into this pattern with some live examples.
What is the Biggest Challenge Most Traders Face?
When to take profits.
Keep a focus on how often we revisit the importance of trendline breaches, and the difference between how trendlines are used when a bottom formation is beginning, and how trendlines are used when exiting a trade and taking some profits.
This will help you get familiar with these two facts:
- the buy signal for a 1-2-3 bottom formation often lines up after a down trend line break,
- the up trend line breach is the sell signal.
Exponential Moving Average Trade Confirmation
From a longer term perspective of 12 hour bars or 24 hour bars, add a 60 period, 20 period Exponential Moving Average as an indicator on your charts. It becomes easy to see the cross over of these EMA are a confirmation of a clear trend.
That’s it. Now you have it, trendline break, 1-2-3 bottom breakout and EMA crossover. All that is left is to practice it!
99% Preparation, 1% Action
This Simple Trading Plan is intended to take a few minutes each day or less to manage. If you are looking at the charts more than a minute or two each, you are spending too much time watching your money work for you – rather than spending your time with friends or family, rather than spending time creating new assets that can also work on your behalf.