1-2-3 Bottom
This pattern occurs at the end of a trend – after the lowest price of the recent downtrend. This 1-2-3 bottom formation can also be found as a 1-2-3 top formation – and it marks the end of an up trend.
1-2-3 Top
Trading for this trend reversal pattern can be used as a very long term strategy. 1-2-3 formations often mark the beginning of price trends that last from several months to several years. Yet this same 1-2-3 reversal pattern can also be found in short-term day trading signals – this is why it is one of the core trading patterns we focus on.
Also know as a ‘trend-reversal pattern’, and always included within ‘head-and-shoulders’ formations, referred to as ‘The W Formation’ and quoted as ‘The Failed Retest’… this trading pattern can be found in so many markets, throughout time, that it goes by many names.
I first learned of this formation from Ken Robers in ‘The Worlds Most Powerful Money Manual and Course’ – and this single chart formation has produced many profits for me since that time.
And I’m honored to pass this golden tip along.
Lets dig into it…
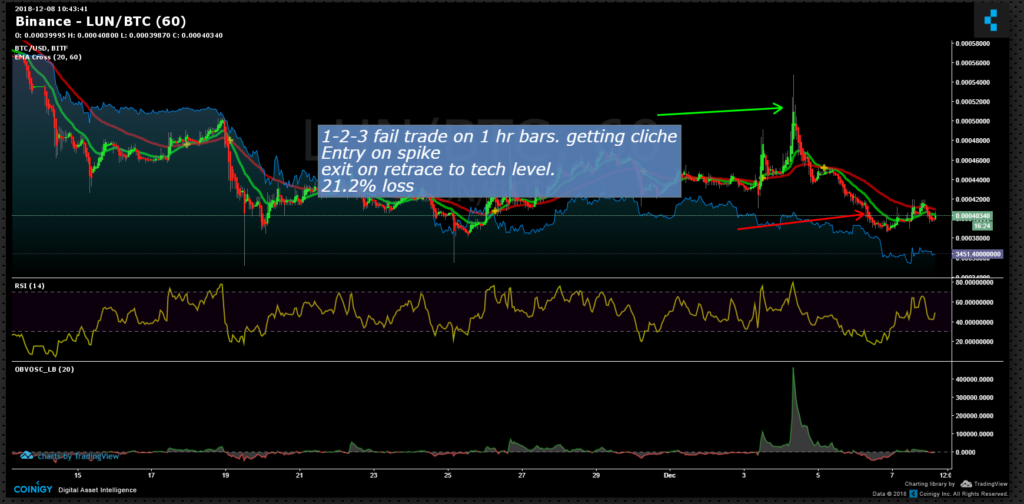
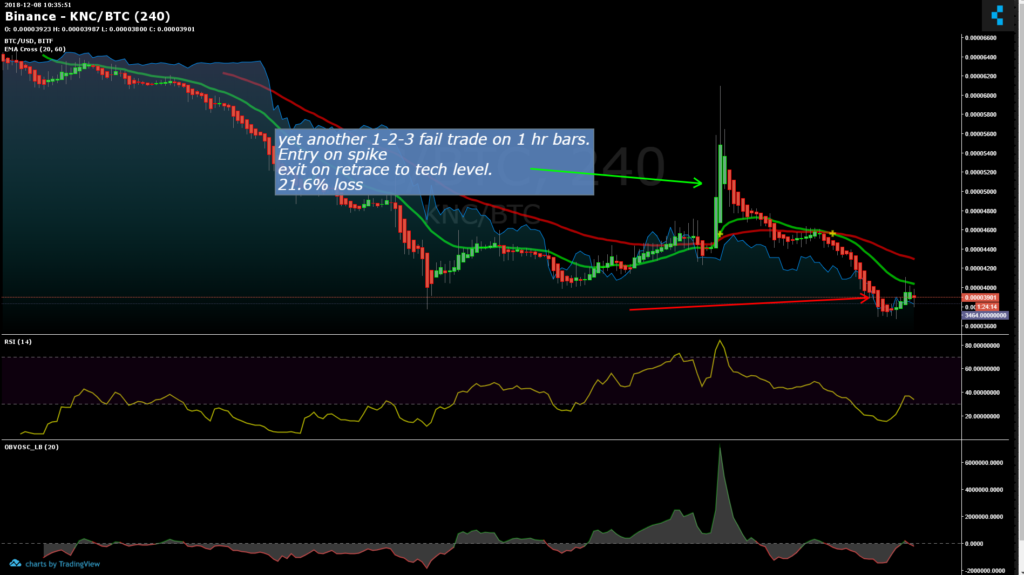
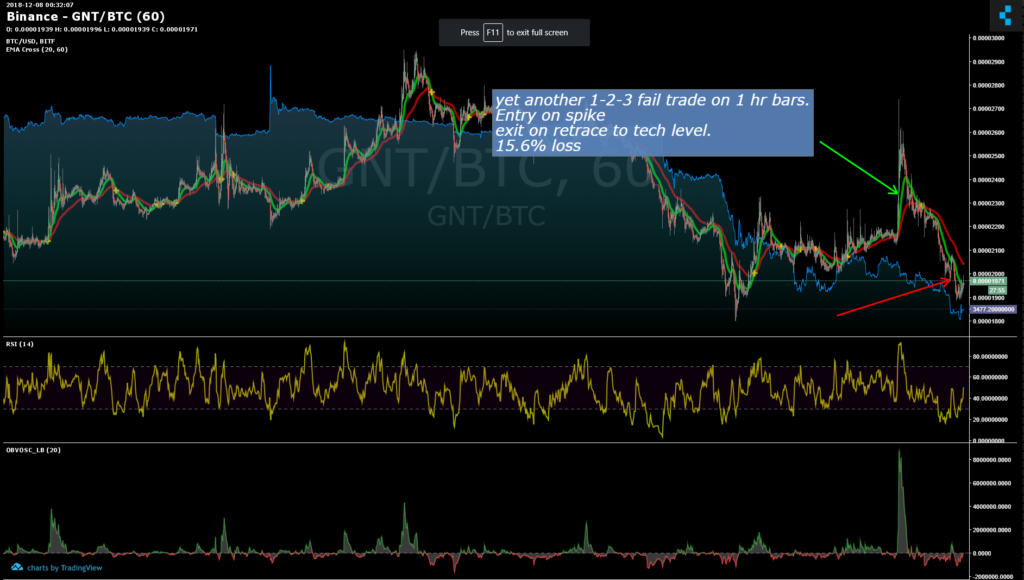
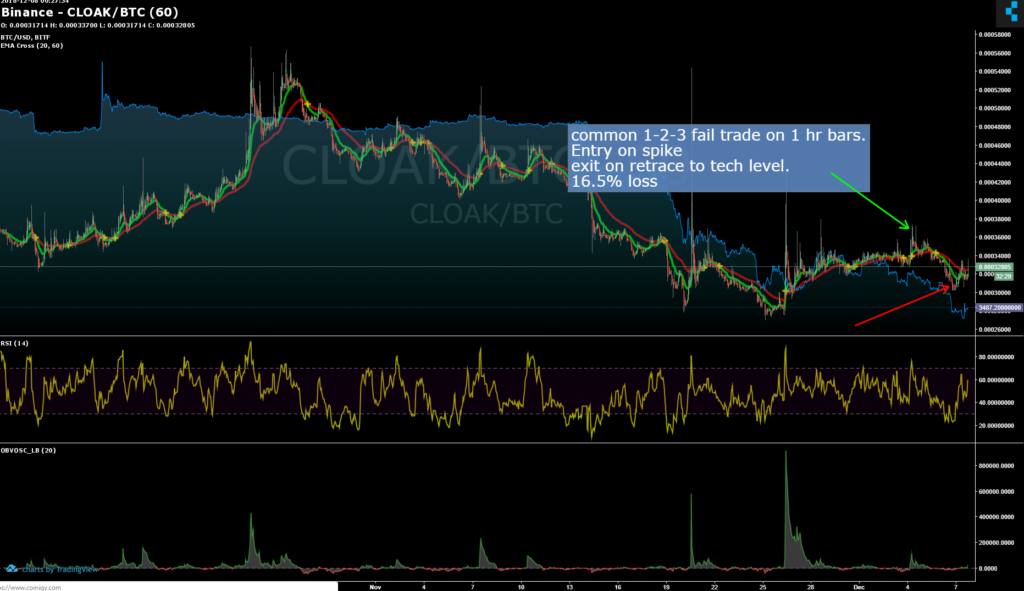
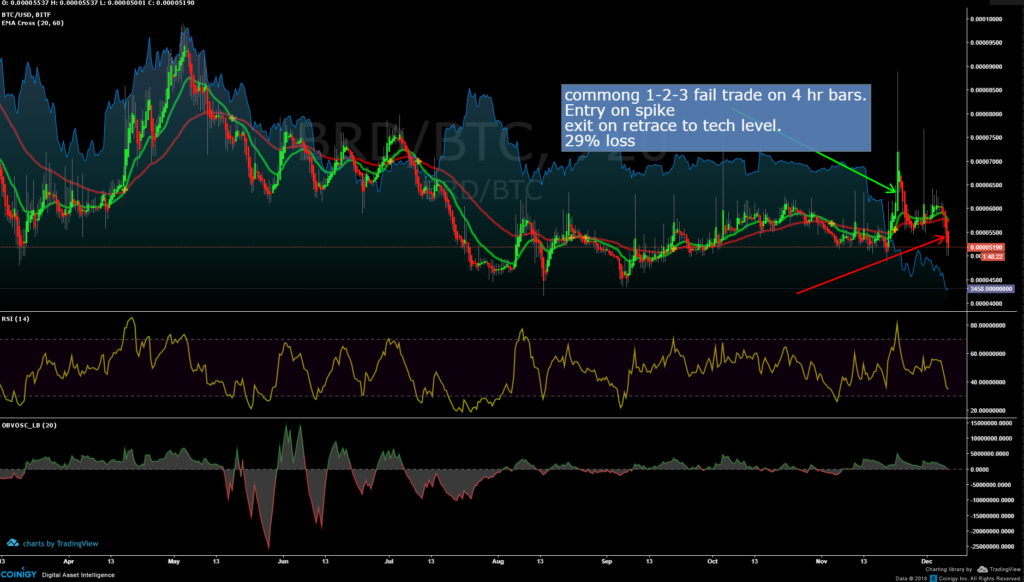
When Does The 1-2-3 Formation FAIL?
My estimation is that the 1-2-3 Formation FAILS more than 8 out of 10 times! It is a trend-reversal strategy, which means it goes against the prevailing trend.
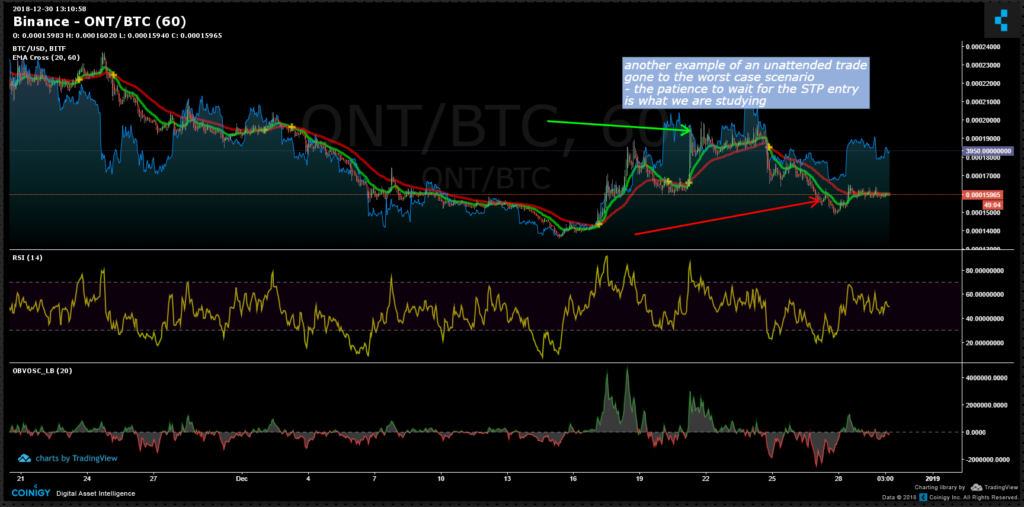
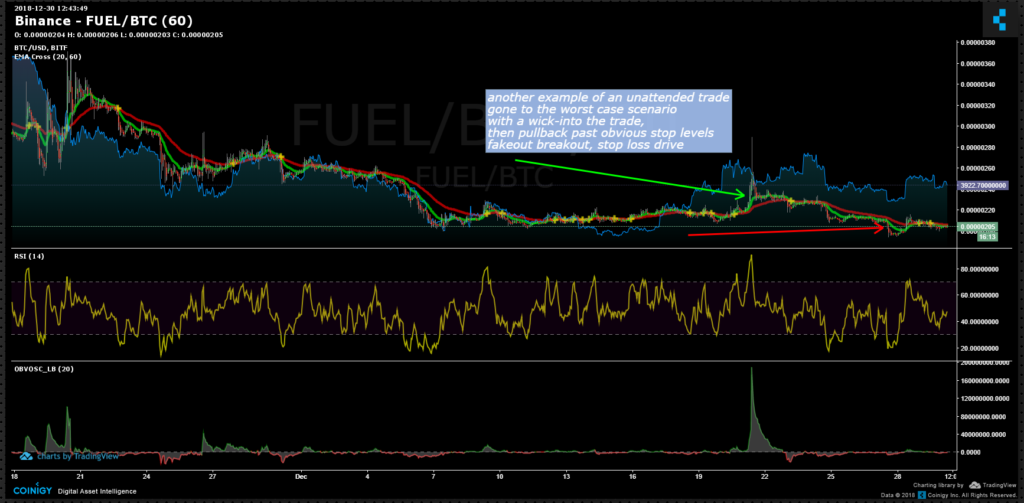
First, this trading formation fails because trending prices often consolidate for a time, then continue on the trend. Often this consolidation almost meets all the requirements of a trend change pattern, but then the trend takes over and prices continue along the larger trend.
Second, the 1-2-3 formation fails because this is a basic and obvious trading pattern – and trader anticipation often causes many ‘Fake-out Break-outs’. As the formation nears the breaking point, a small number of excited traders take positions and push the market just past the trendline… but then, larger market forces come back into play and continue the trend.
Can You Identify The Pattern?
Three Ways To Limit Loss
One way to reduce the number of losses you may take when testing a bottom formation – is to include additional indicators such as ‘Exponential Moving Average Crossover, a Trendline Breach, divergences between related markets – and wait to only trade on confirmation of the trading signal, never enter positions within a ‘potential’ formation, and always use risk control rules for additional protection.
The most important component is the failure in using pre-defined buy levels and stop loss levels without considering what is required to complete your commitment to follow the Risk Control Rule #1: To assume you are wrong when putting on a trade, and to reduce or remove your position unless the market proves you correct. The example charts here remind a new trader the important distinction between using Rule #1 and remaining in control of when you are wrong.
Another way to reduce the size of your losses may be to take smaller position sizes and allow wider stop loss parameters when entering positions – especially when trading short-time-frame views in the early stages of a down trend reversal. This is the practical approach to using Risk Control Rule #2 when setting up the size of any individual trade.
Springboard Variation of the 1-2-3 Bottom
How To Watch For and Identify The Right Moment
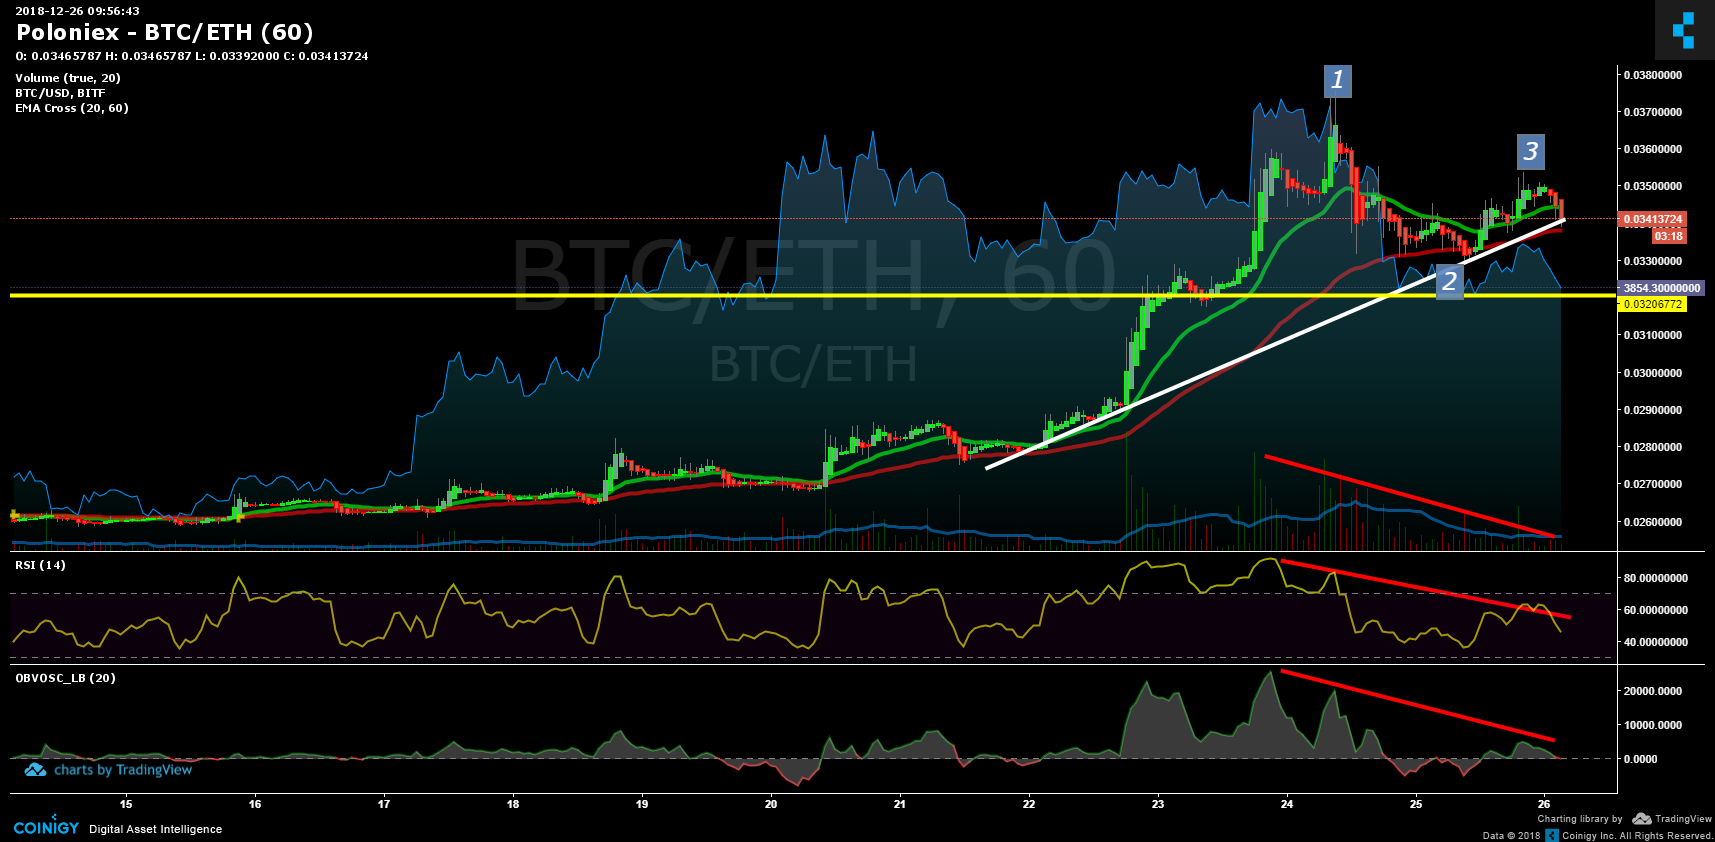
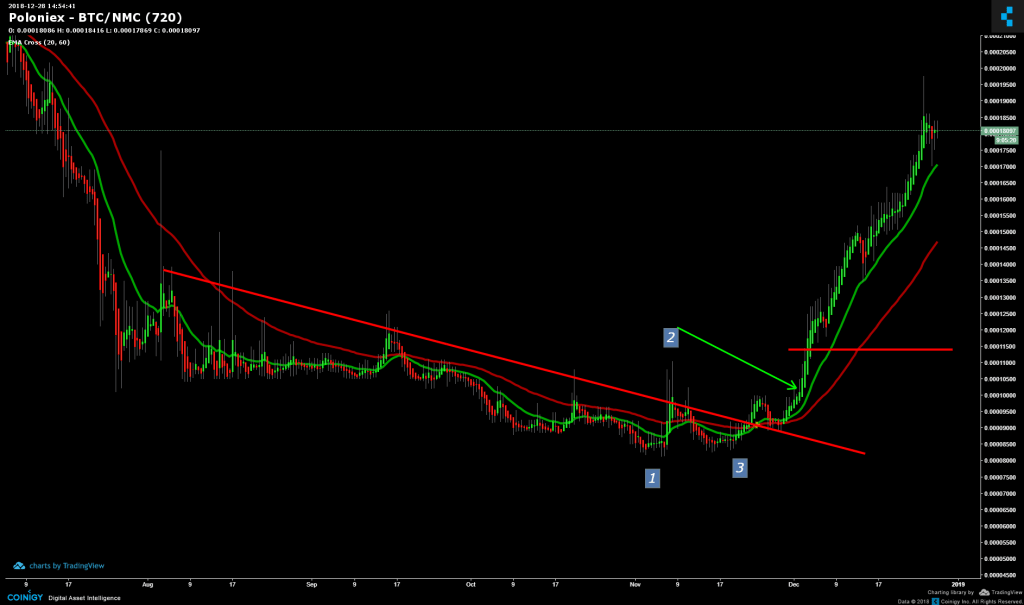
Imagine we are following the progress of a market that has been undergoing a long downtrend.
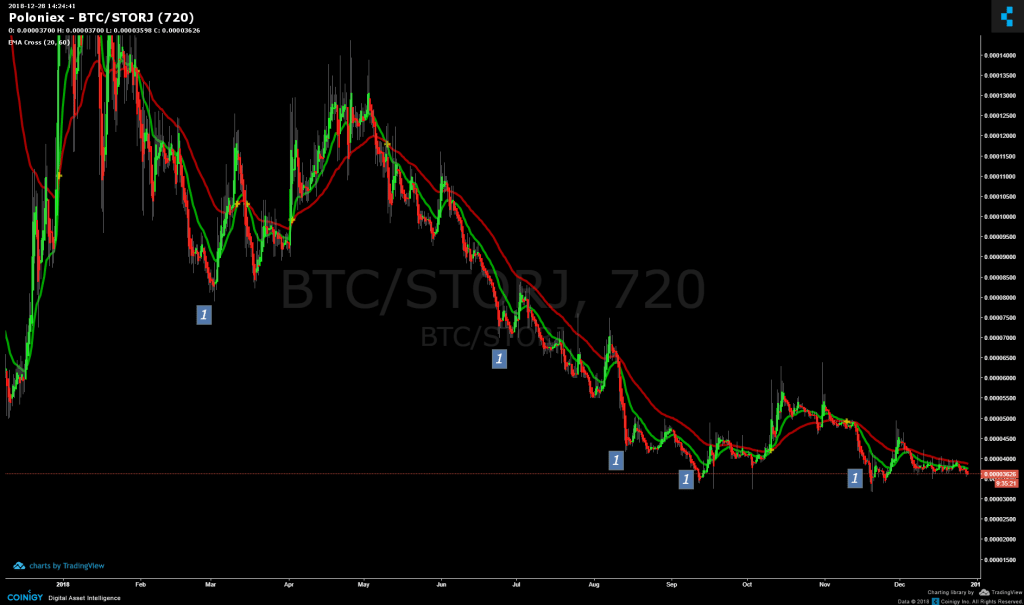
Each time the market makes a new low price, that point is called the #1 point. The time-frame of the downtrend can be years, or hours, but for the purpose of our Simple Trading Plan for micro-investing, we will focus on the 12 hour bars in a three to six month view.
When the market prices rebound higher from that lowest price, each time the price makes a new high, that point is labeled the #2 point. When the price rebound loses steam, we begin to watch the price more closely – getting poised for our entry.
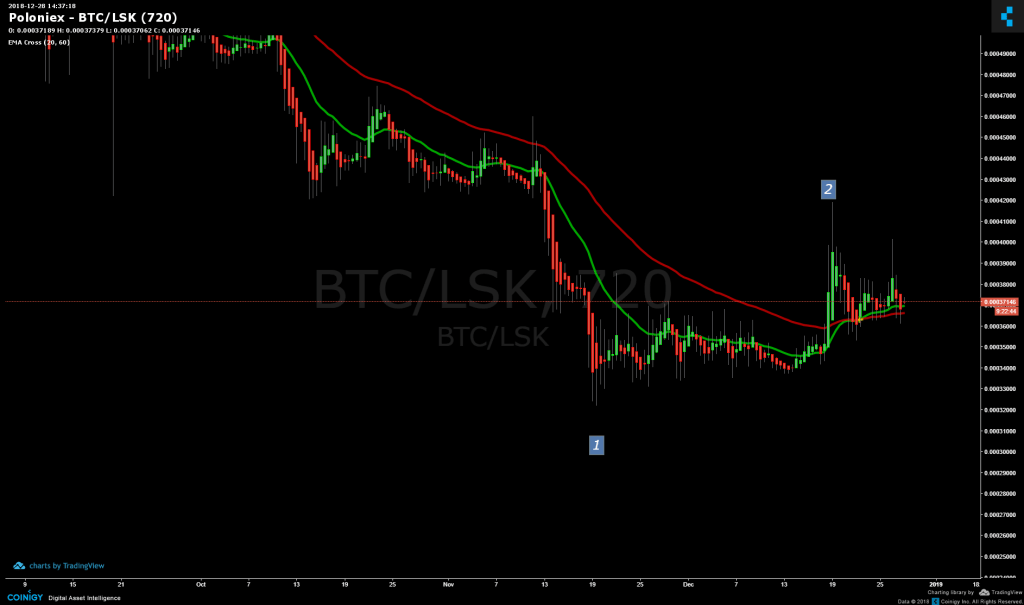
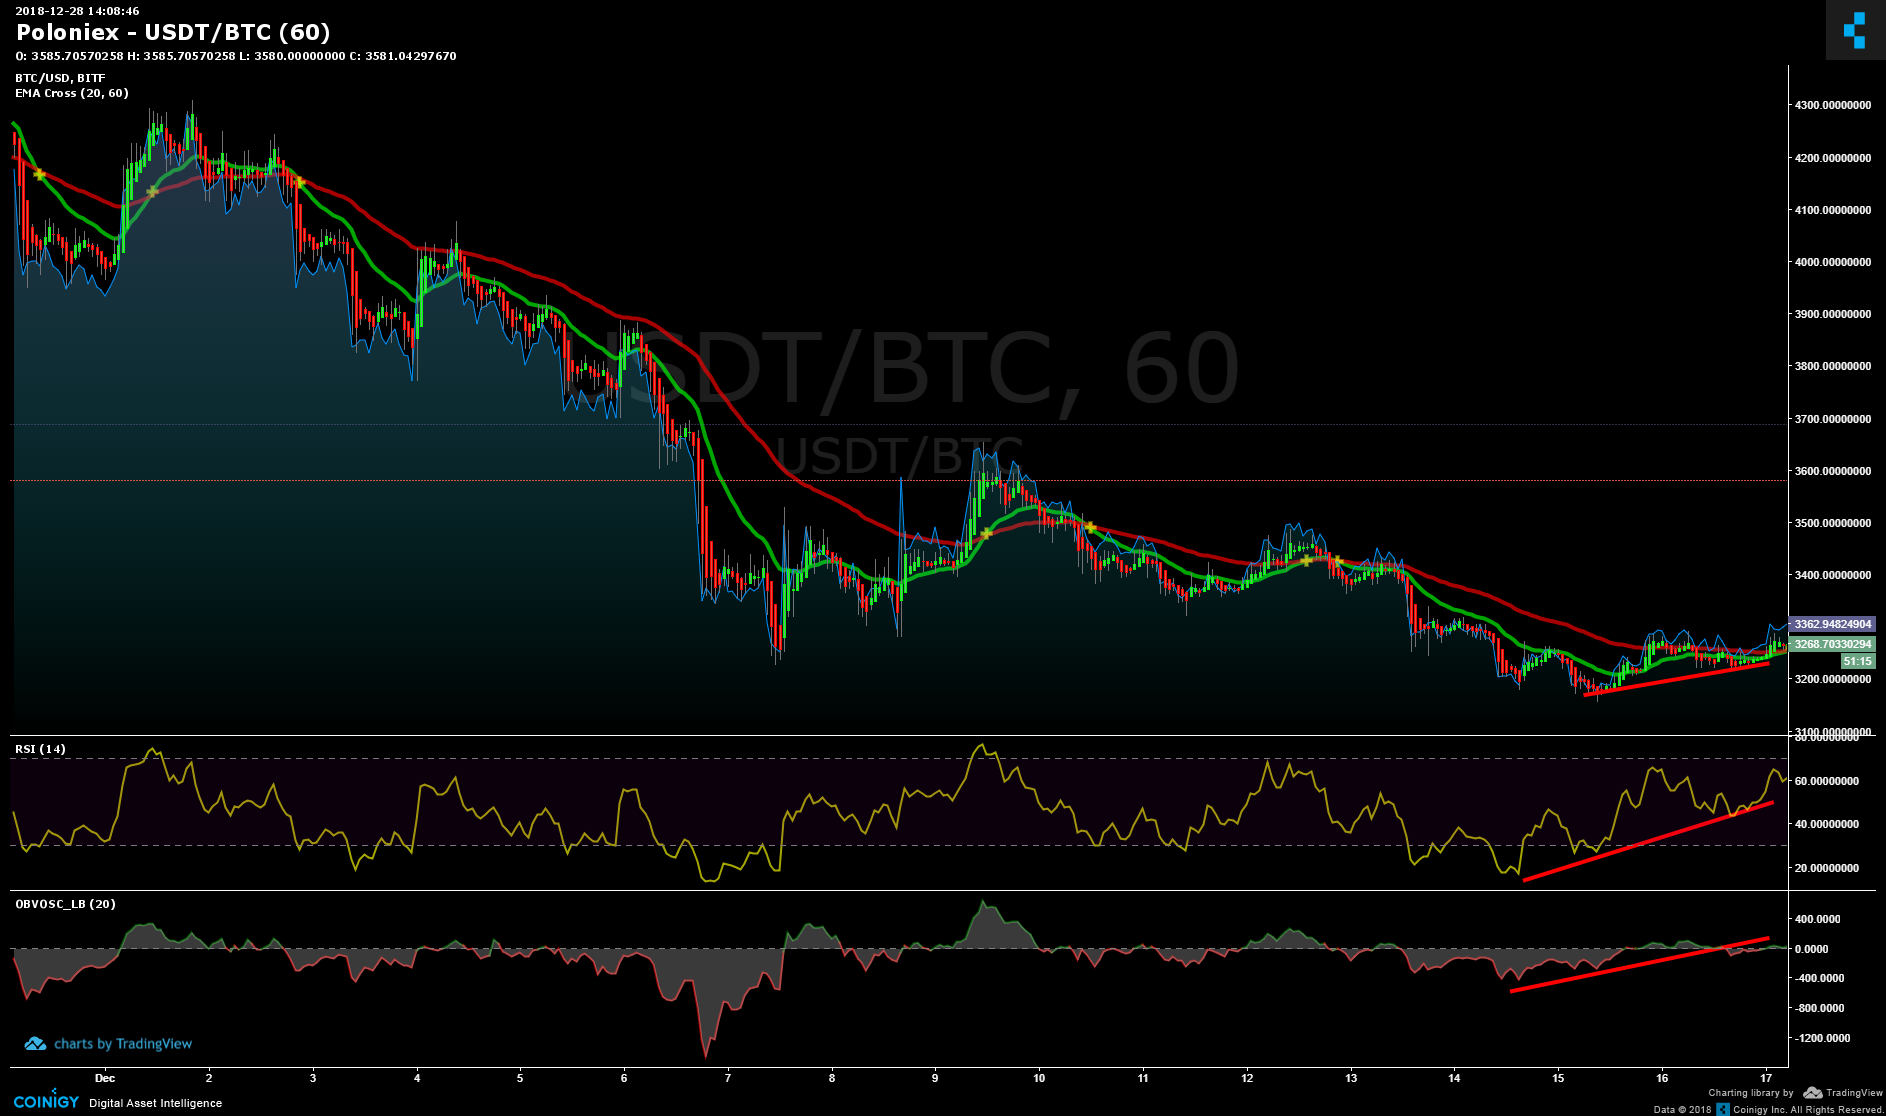
We are watching for a specific situation where the price slides, the bears try push the prices to new lows, but prices fail to break to new lows. As the prices fail to continue the downtrend, there comes a moment where three signals will line up at the same time:
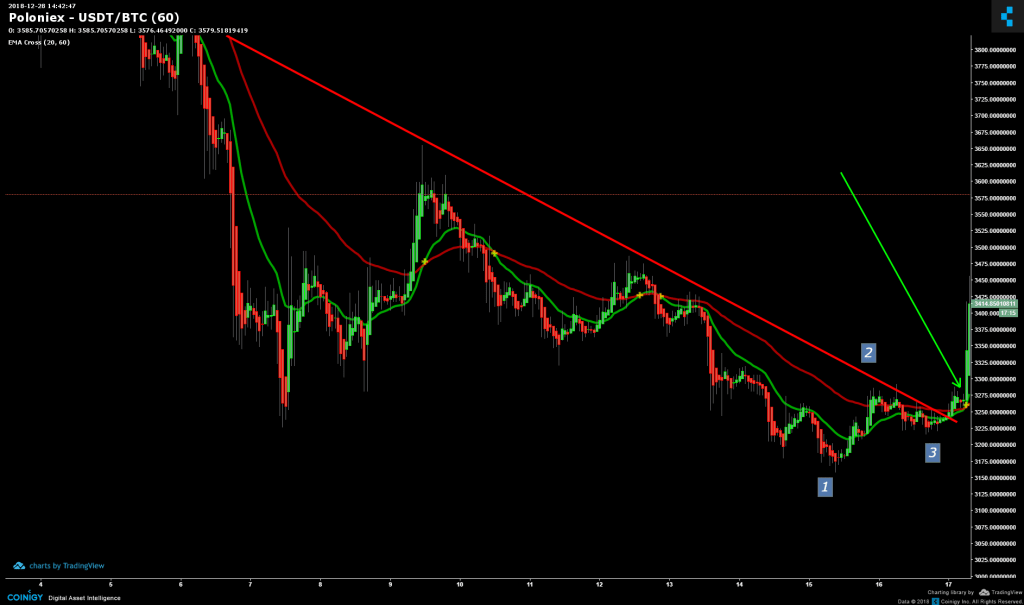
The down trendline is broken, the 1-2-3 formation is broken and finally the EMA crosses over to confirm.
That signals our entry… using Rule #2 to determine our position size, and Rule #1 as guard against fakeout breakouts… the moment the trade is placed, we are assuming we are wrong, that the trend will continue downward – and stand prepared to close this initial small position.
When proven correct, move the stop loss above the break-even level and then let prices do their thing, actively watching for the right time to add on to the position. When proven correct, we want to increase our risk.
Now that we have covered the basics of recognizing 1-2-3 top and bottom formations, you have surely been looking at historical price charts for everything from Ethereum, Gold, Pork Bellies, British Pound, Corn Futures, Apple Inc. stock prices – and you’ll find this chart formation is everywhere that a trend changes direction!
It is very exciting and a very valuable piece of knowledge!
In Week 3, we will review the number of 1-2-3 bottom formations across the past three crypto bull markets – and as we compare those patterns to those that are shaping up in the chart now, it will become more clear where and when we should be taking action on those formations.
Range Breakout Trading
This is not as common in trading altcoins – but becoming more important as the markets are gaining more market cap.
This is a short to medium term trading signal, intended to catch abrupt moves and take profits. A trading portfolio focused on this method would not be fully invested in the Markets at all times, but rather would only be in a position for short periods, and the equity in the account would be liquid most of the time.
Trades are triggered in this strategy after prices have consolidated into a specific range pattern. Several patterns are common for traders to watch for. Many traders often combine the entry point with a technical indicator to help filter out the ‘fakeout-breakouts’ that often occur.
Because of the short-term nature this strategy, rule number one and rule number two would be used differently for a ‘range breakout trade’, then for a ‘trend reversal trade’ that is intended to hold for a long period of time. I’ll refer you to Chapter 8 of the book by Phantom of the Pits.